According to the Association of British Insurers (ABI), the UK insurance market is worth a reported £1.8 trillion. Part of this sum is generated by landlord insurance.
Landlord insurance aims to provide financial protection to the estimated 2.82 million private landlords in the UK. It helps cover risks associated with renting out property to tenants, including the following:
Given the importance of this market, Confused.com has collated a definitive report outlining the latest UK landlord statistics for 2024. This includes a breakdown of UK landlord demographics. It also covers the factors that can affect the average cost of landlord insurance and the number of claims.
Top 10 UK landlord statistics 2024
There are around 2.82 million private landlords in the UK
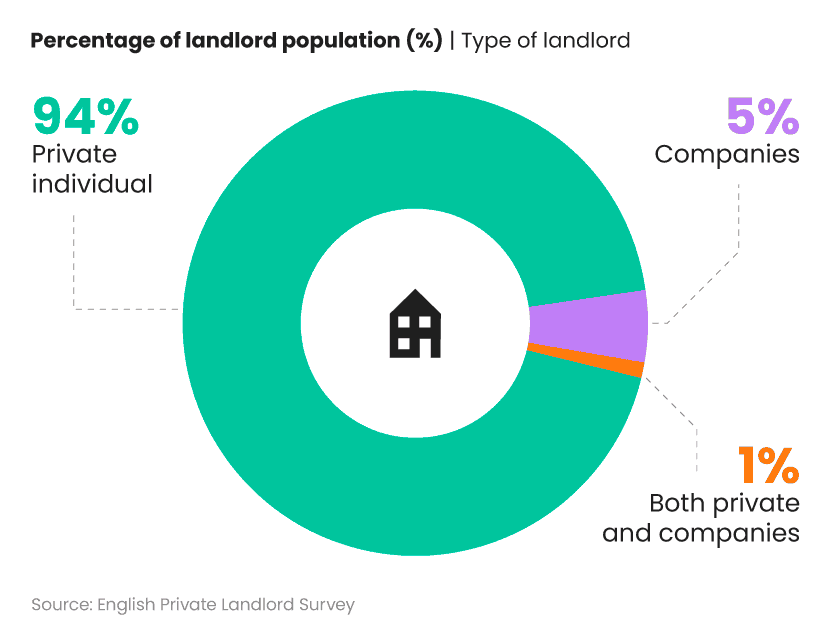
Around 94% of landlords are private individuals
The average age of landlords in the UK is 58.1
The most popular reason for becoming a landlord is for investment purposes (42.3%)
Just over a third (34.9%) of UK landlords are retired
Around two-fifths (43%) of UK landlords have just 1 property in their portfolio
Around 4 in 5 landlords (84.2%) are unwilling to let to people with a history of rent arrears
The average cost of landlord insurance in the UK is £260.42.
The most common landlord insurance claim for 2023-24 was for escape of water, which accounted for 27.57% of all claims for the year
The average cost of a claim for escape of water during 2023–24 was £37,792
UK landlord population statistics
How many landlords are there in the UK?
According to the English Private Landlord Survey, there are an estimated 2.82 million private landlords in England. These landlords own or manage privately rented properties.
Private rental market statistics reveal that the number of households in rented accommodation increased by 42% between 2008 and 2021. It went from 3.1 million to 4.4 million households. It’s now the second-largest type of occupancy in England, accounting for almost a fifth (19%) of all households.
Number of landlords in the UK by landlord type
A breakdown of the number of landlords in the UK by type of landlord
The vast majority (94%) of UK landlords are private individuals, with around 1 in 20 rented homes (5%) leased out by companies.
Number of landlords in the UK by age
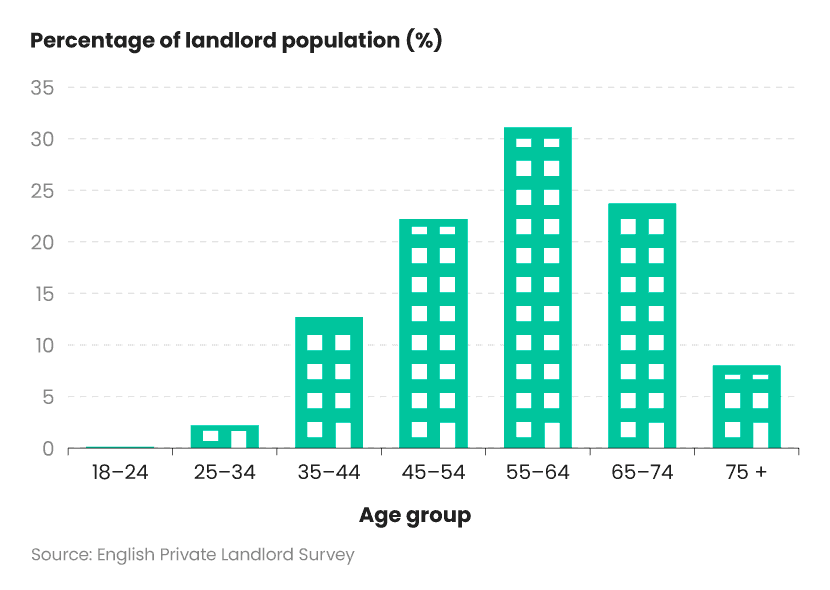
According to the English Private Landlord Survey, around a third (31.1%) of UK landlords are aged between 55 and 64. This is the most common age bracket.
A breakdown of the number of landlords in the UK by age
Around a quarter (23.7%) of landlords are aged 65–74 and a fifth (22.2%) are between 45 and 54. In all, 85% of UK landlords are aged over 45.
What is the average age of a UK landlord?
58.1
Most popular reasons for becoming a landlord
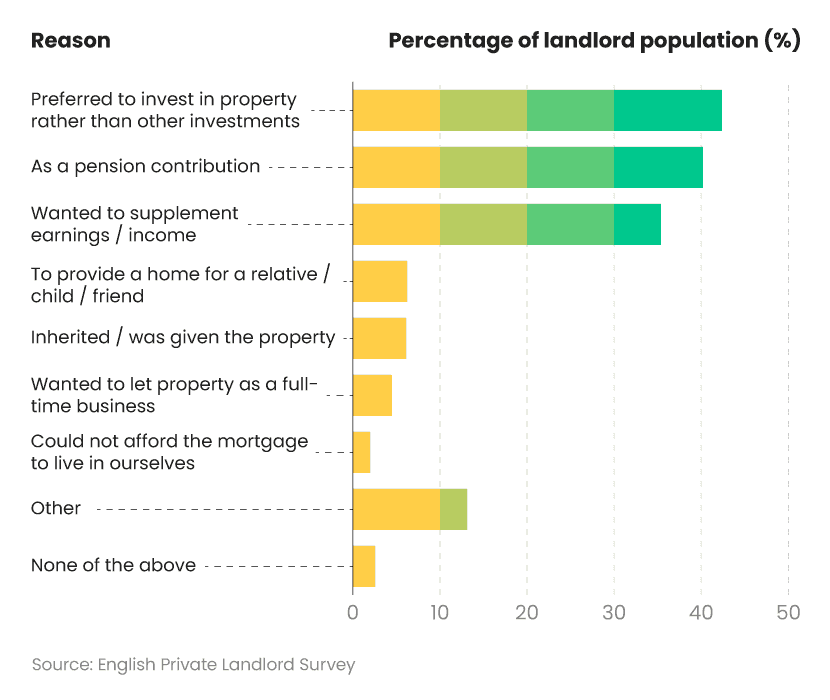
Around 2 in 5 (42.3%) landlords said that they preferred renting out property compared to other investment options. A similar percentage (40.1%) claimed they rented out property to help fund pension contributions. These were the two most popular reasons for becoming a landlord in the UK.
A breakdown of the most common reasons for becoming a landlord
In addition, just over a third (35.3%) of landlords saw renting out property as a way to supplement their earnings or income.
Considering becoming a landlord? Check out our guide to landlord responsibilities to find out more about what being a landlord entails. Plus, find out what you’re legally required to do when renting out property.
Number of landlords in the UK by employment status
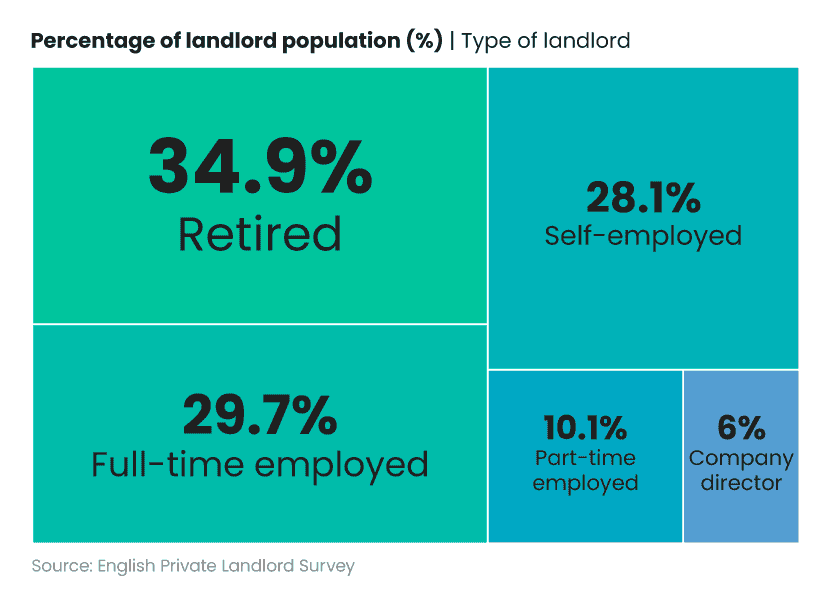
Just over a third (34.9%) of UK landlords are retired, while less than 1 in 3 (29.7%) are in full-time employment.
A breakdown of the number of private landlords in the UK by employment status
Just over a quarter (28.1%) of landlords in the UK are self-employed, with around 1 in 10 (10.1%) in part-time employment.
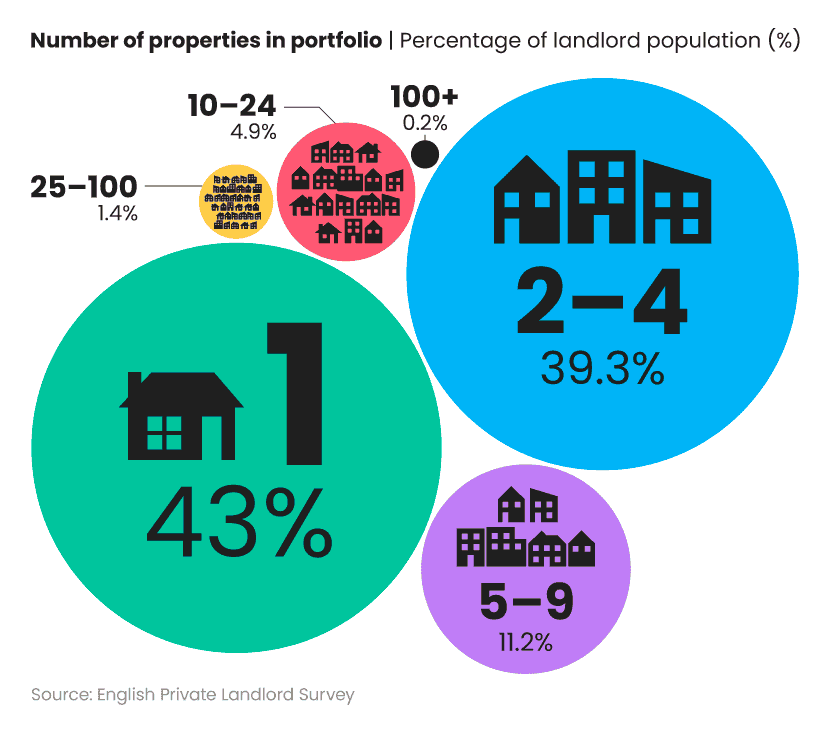
Number of landlords in the UK by portfolio size
In terms of portfolio size, the majority of UK landlords have just 1 property on their books. These landlords provide around two-fifths (43%) of the total rental market.
A breakdown of the number of landlords in the UK by number of properties
Generally speaking, as portfolio size increases, the percentage of landlords decreases.
Just under 2 in 5 (39.3%) UK landlords are responsible for between 2 and 4 properties. For those with 5-9 properties, this figure is around 1 in 10 (11.2%).
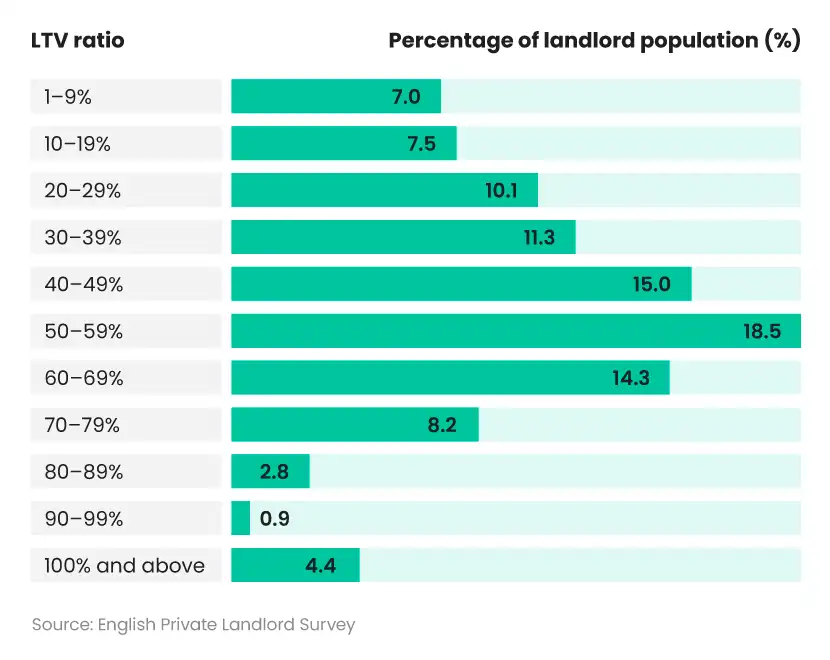
Number of landlords in the UK by portfolio loan-to-value (LTV) ratio
The LTV ratio for a landlord’s portfolio typically represents the size of their mortgage(s) compared to the value of all their properties. It is expressed as a percentage.
The average LTV ratio for UK landlords stands at around 62.8%. This means, on average, landlords have mortgages that are equal to three-fifths of their properties’ property’s (or properties’) values.
A breakdown of the number of landlords in the UK by portfolio LTV ratio
According to the English Private Landlord Survey, almost a fifth (18.5%) of landlords have an LTV ratio of 50-59% for their portfolio. This is the most common percentage in the study.
The LTV ratio for a landlord’s portfolio tends to be normally distributed. It starts with 7% of landlords having an LTV ratio of 1-9%. From there, it rises to 18.5% for those with 50-59% LTV ratio. It then gradually dips, with just 0.9% of landlords having a 90-99% LTV ratio. Around 1 in 23 (4.4%) UK landlords have an LTV ratio of 100% or above.
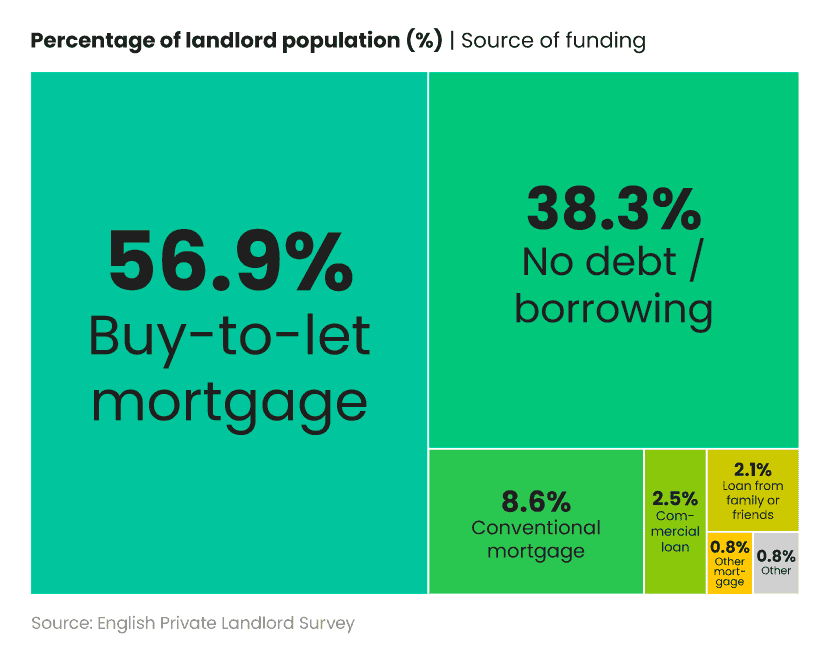
Most common source of funding for UK landlords
More than half (56.9%) of UK landlords use a buy-to-let mortgage as their primary funding source when buying property.
A breakdown of the most popular sources of funding for landlords in the UK
By contrast, just under 1 in 10 use a conventional mortgage (8.6%). Almost two in five (38.3%) didn’t require any debt or borrowing in order to purchase their property.
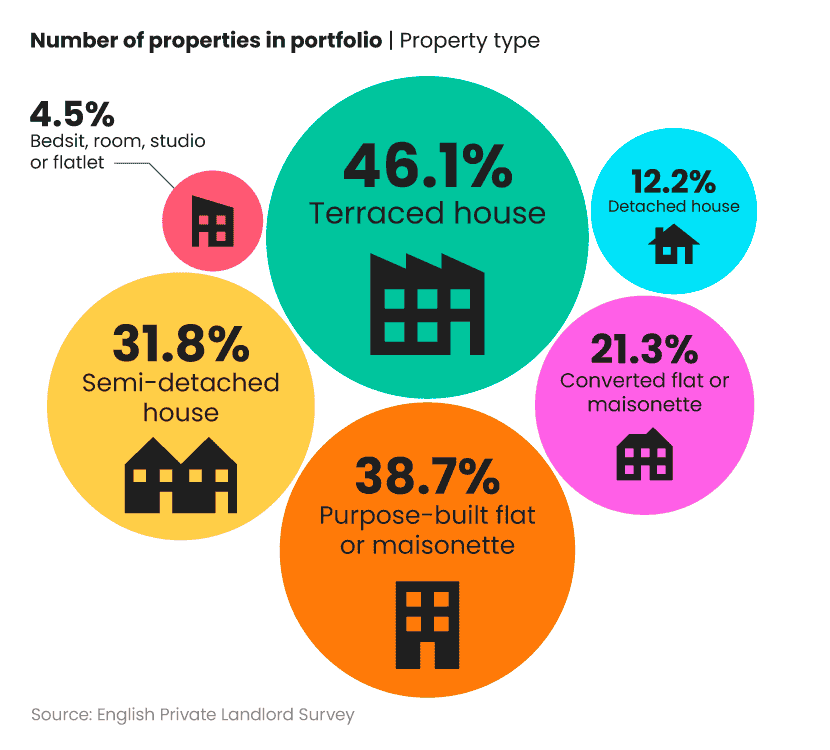
Number of landlords in the UK by property type
The most common type of property owned by UK landlords is a terraced house. This type of housing accounts for just under half (46.1%) of all rental properties in the UK.
A breakdown of the number of landlords in the UK by type of property
Meanwhile, around two-fifths (38.7%) of UK landlords rent out purpose-built flats or maisonettes. Just under a third (31.8%) own semi-detached houses.
By contrast, there are around 2.5 times more semi-detached rental properties in the UK than detached ones. Detached homes make up around 1 in 10 (12.2%) of the UK rental market.
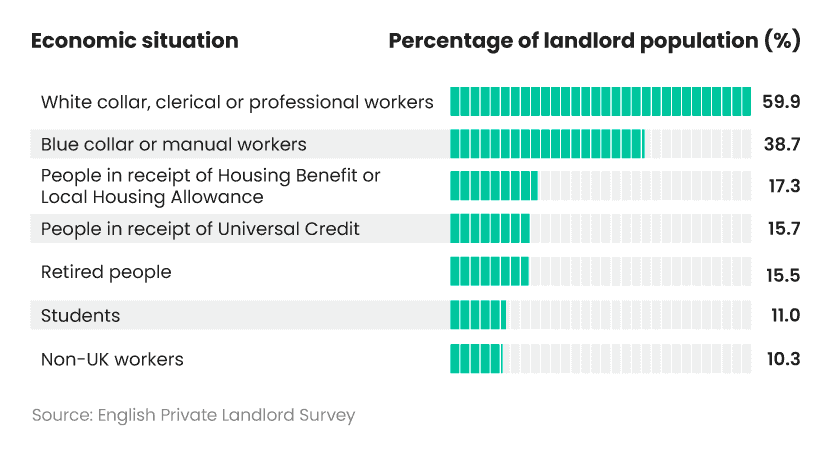
Number of landlords in the UK by tenant type
Around three-fifths (59.9%) of UK landlords rent to white-collar, clerical or professional workers. This makes them the most common type of tenant for private landlords in the UK.
A breakdown of the number of private landlords in the UK by type of tenant
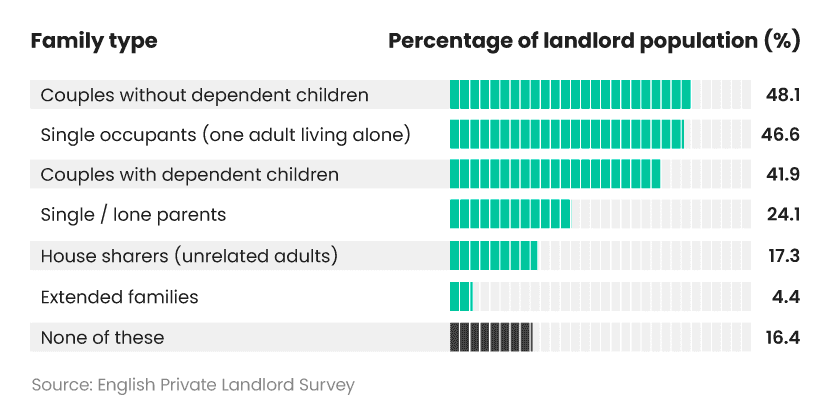
The English Private Landlord Survey also reveals that just under half (48.1%) of tenants are couples without dependent children. There’s a similar number (46.6%) of single occupants – that is, 1 adult living alone.
A breakdown of the number of private landlords in the UK by type of family
Around two-fifths (41.9%) of the UK rental population are couples with dependent children, compared to just under a quarter (24.1%) who class themselves as single parents.
Did you know that tenant insurance can help protect your belongings in rented accommodation? It’s not a legal requirement, but can help cover the cost of damage, theft or loss of your belongings while renting.
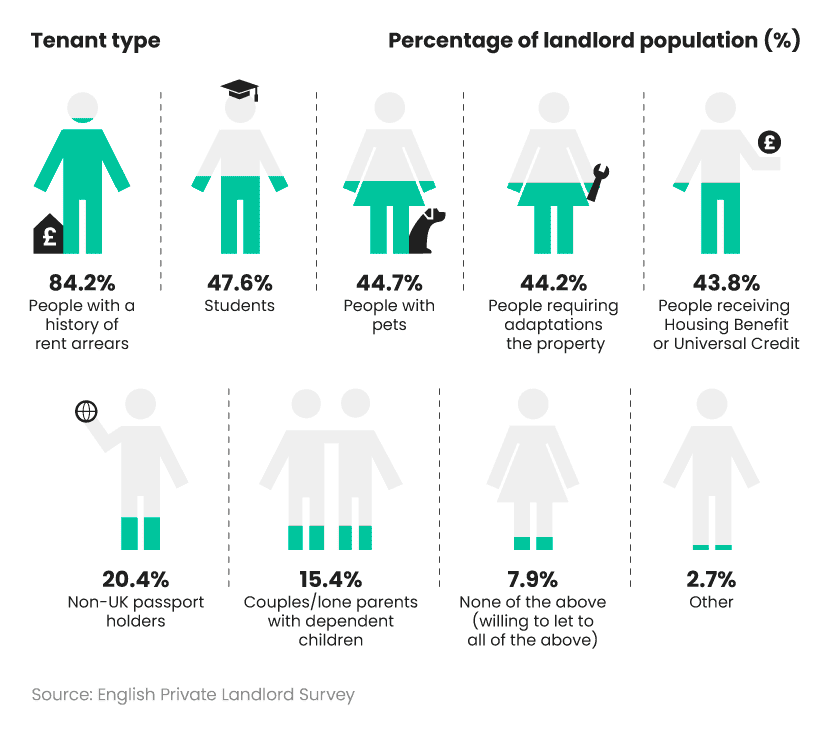
Most common groups of people landlords are not willing to let to
The most common group of people that landlords aren’t willing to let property to are those with a history of rent arrears. More than 4 in 5 (84.2%) landlords considered tenants who had a track record of not paying rent as undesirable. They were almost two times less popular than the next type of tenant.
A breakdown of groups landlords are not willing to let to
By contrast, just under half (47.6%) of landlords said they didn’t like renting to students.
Just over two-fifths (44.7%) of landlords also preferred not to rent to those with pets. People requiring adaptations to the property were shunned by 44.2%. It was a similar story for those receiving Housing Benefits or Universal Credit, with more than 2 in 5 landlords (43.8%) considering them to be undesirable tenants.
Most common reasons for wanting to let to households on benefits
For those receiving benefits, around 7 in 10 (69.1%) landlords felt this posed a greater risk of unpaid rent. Around two-thirds (65.6%) were also concerned that the benefits received would not cover the cost of rent, leading to a further loss of money.
A breakdown of the most popular reasons for not letting to households on benefits
| Reason | Percentage of landlord population (%) |
|---|
| Greater risk of delays in payment or unpaid rent | 69.1 |
| Risk that these benefits will not cover all the rent | 65.6 |
| Benefits are paid directly to the tenant and not to the landlord or agent | 53.1 |
| Greater risk due to plans to remove Section 21 of the Housing Act | 50.5 |
| High demand from other types of tenants | 49.6 |
| Greater risk of disturbance or anti-social behaviour or damage to property or furnishings | 48.7 |
| Lack of support for dealing with Universal Credit related issues | 40.4 |
| Not enough knowledge or experience of these benefits | 37.6 |
| Too much paperwork or problems with administration | 36 |
| Risk of fraudulent benefit claims | 27.7 |
| Mortgage or insurance company restrictions | 24 |
| Only let to family, friends, employees or other specific types of tenants (students, nurses etc.) | 8.9 |
Source: English Private Landlord Survey
Just over half (53.1%) of landlords are unwilling to rent to those on benefits as they are paid directly to the tenant and not the landlord.
A similar percentage (50.5%) is also worried about plans to remove Section 21 from the Housing Act. Section 21 the right to recover possession of a rental property by serving a minimum of 2 months’ notice in writing. This would make it harder for landlords to evict undesirable tenants and could mean they are stuck with them for longer.
Worried about not getting your rent each month? Rent guarantee insurance is available to help ensure you’re not left out of pocket if your tenant can’t keep up with their monthly payments.
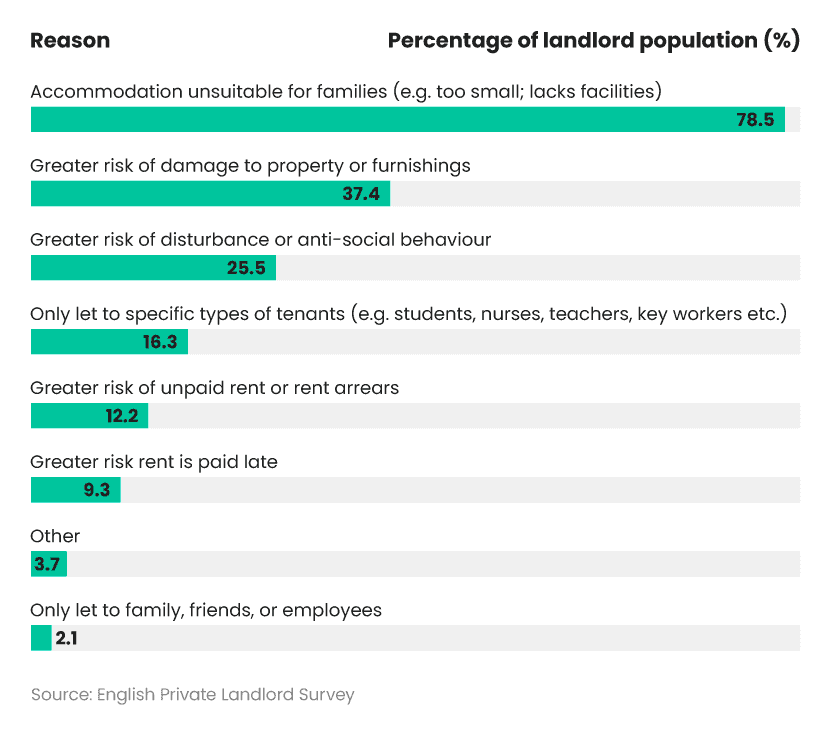
Most common reasons for not wanting to let to households with children
More than three-quarters (78.5%) of landlords who are unwilling to rent to households with children claim that their accommodation is unsuitable for families. They’re either too small or lacking the facilities needed to support children.
A breakdown of reasons given for not letting to households with children
Around half this number (37.4%) believe families with children pose a greater risk of damage to property or furnishings. Over a quarter (25.5%) of landlords suggest that they are noisier tenants, posing a greater risk of disturbance or anti-social behaviour.
How many MPs are landlords?
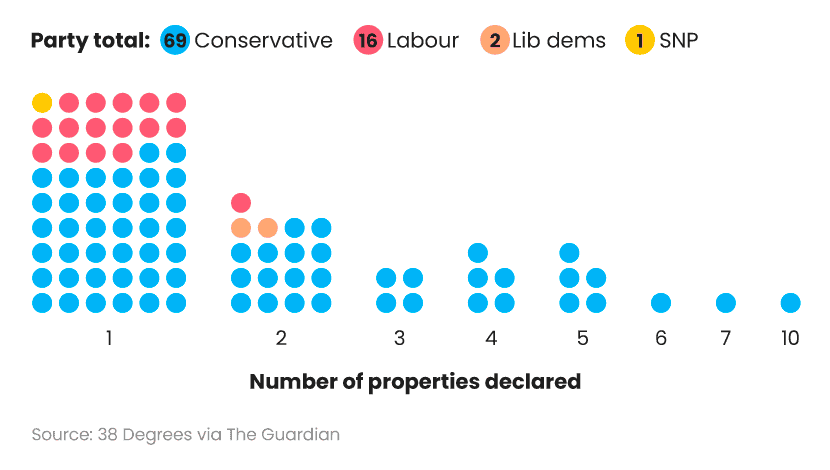
According to research by the campaign group 38 Degrees, there were 88 MPs in 2023 who were residential landlords with a declared annual income of over £10,000. This means around 1 in 8 (13%) of the Commons’ MPs are landlords.
Around three-fifths (61%) of MPs claimed rental income for one property. Almost 1 in 5 (19%) from 2, and a similar percentage (19%) for 3 or more rental properties.
How many Tory MPs are landlords?
69
A breakdown of how many MPs are landlords from different political parties
More than three-quarters (78%) of landlords were Conservative MPs, with the vast majority of the remaining 22% falling under Labour. In total, this means that almost 1 in 5 Tory MPs were landlords as of 2023.
By contrast, only 4% of the UK population declare income from renting property.
How many Labour MPs are landlords?
16
UK landlord insurance statistics
UK landlord insurance cost statistics
The average cost of landlord insurance is determined by several factors, including the property’s:
Type
Age
Number of bedrooms
Value of sums insured
Type of tenant
Location
The way you choose to pay – monthly vs. annually – also affects the cost.
What is the average cost of landlord insurance?
According to Confused.com’s own data, the average cost of landlord insurance in the UK in 2024 stood at £260.42 before insurance premium tax (IPT). This represents a rise of 9.7% within the last year.
Has the cost of landlord insurance gone up?
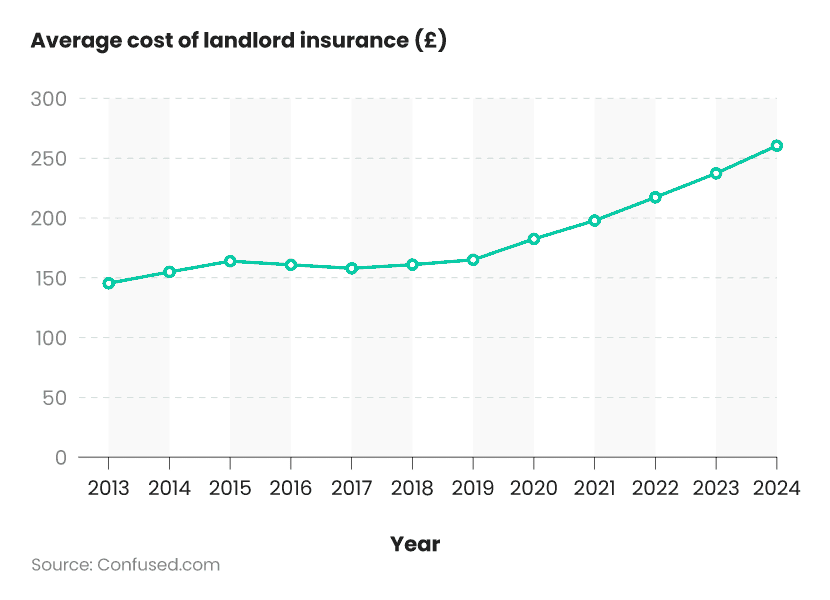
The average cost of landlord insurance has generally risen year-on-year. According to our data, in 2013, a typical UK landlord paid around £145 for their insurance, excluding IPT. Within 10 years, this had risen by more than three-fifths (+63.1%) to almost £238.
A breakdown of the average cost of landlord insurance (excluding IPT) in the UK over time
Two years, 2016 and 2017, bucked the trend slightly by showing a small decrease in the average price of landlord insurance. The price of the average policy fell by £3 during this period, resulting in a typical annual cost of just under £158 by the end of 2017.
Factors that affect the average cost of landlord insurance
UK landlord insurance average cost by property type
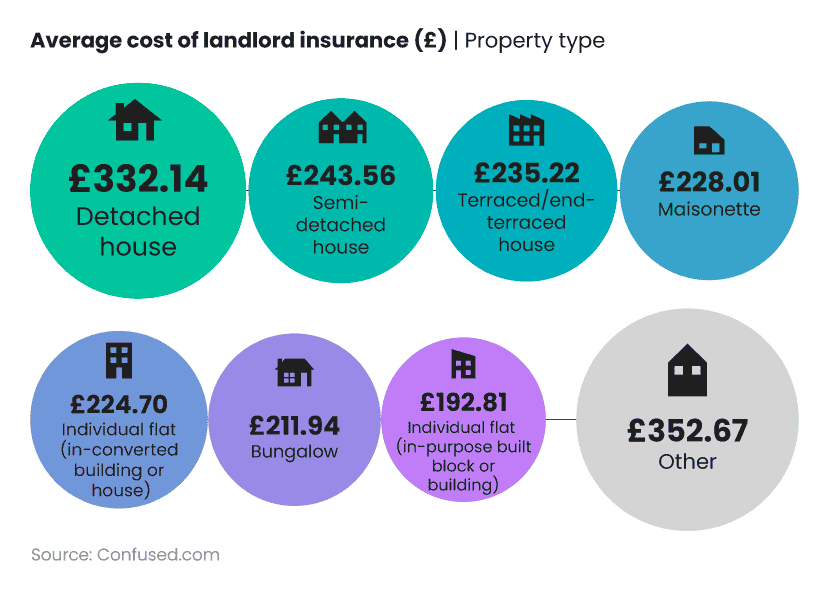
Just under half (45%) of Confused.com customers are landlords of terraced or end-of-terrace houses – the most common type of rental property. The average price of landlord insurance for this type of policy was £235.22, excluding IPT.
A breakdown of the average cost of landlord insurance (excluding IPT) by type of property
Individual flats – either purpose-built blocks or buildings – tend to be the cheapest for landlord insurance. The typical asking price for a policy for this type of property is £192.81 (excl IPT). It’s around four-fifths (82%) of that typically quoted to cover a terraced house.
By contrast, detached housing tends to have one of the highest average costs for landlord insurance at £332.14 (excl IPT). This is almost three-quarters (72.3%) more than for a typical UK flat.
UK landlord insurance average cost by age of a property
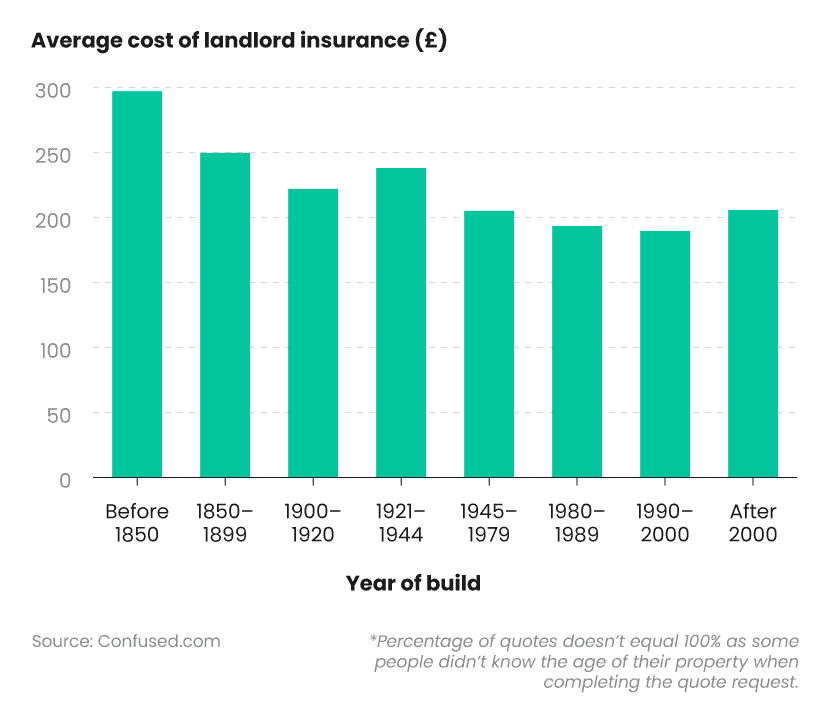
The age of a property has a bearing on the price of landlord insurance. The older it is, the more you will tend to pay. Properties built before 1850 usually cost landlords the most to insure at £296.70 (excl IPT). This is around two-fifths more (+44.1%) than the cheapest: those between 1990-2000.
A breakdown of the average cost of landlord insurance (excl IPT) by year of build
The most common build-year period for Confused.com customers was between 1945 and 1979. Properties built during this period represented more than a quarter (27%) of all quotes between 2023-24.
The average cost of landlord insurance for these properties was £204.91, excluding IPT. This is around the same as for a policy for a typical property built after 2000.
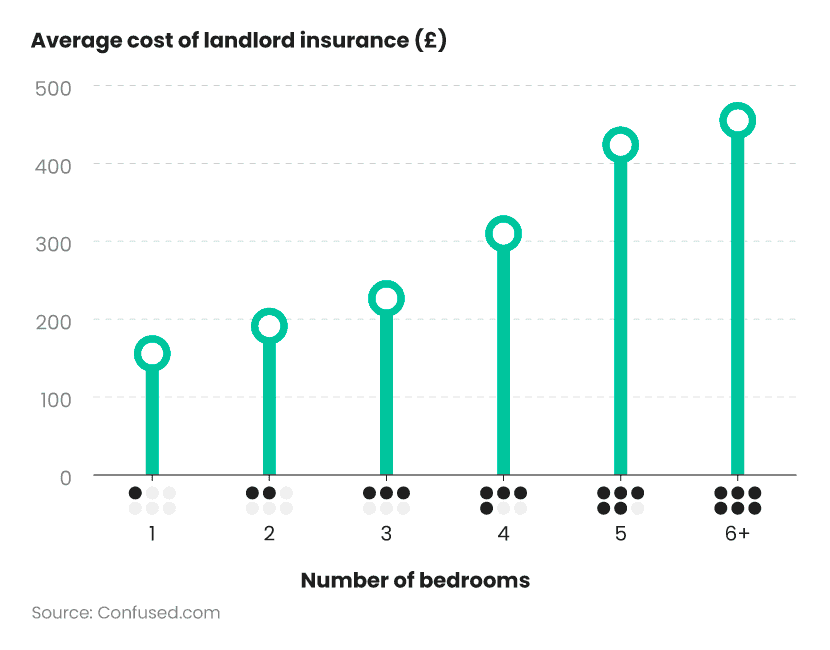
UK landlord insurance average cost by the number of bedrooms
The average cost of landlord insurance tends to rise with the number of bedrooms. For example, a 1-bedroom rental property typically costs £172.82 a year to insure compared to £475.36 for a home with 6 or more bedrooms. Both figures exclude IPT. This makes the larger property 2.75 times more expensive than the smaller one.
A breakdown of the average cost of landlord insurance (excl IPT) by the number of bedrooms
Just under half (47%) of Confused.com landlords owned properties with 3 bedrooms. The average cost for a policy for this type of property is £243.57 – around a quarter (25.5%) cheaper than a typical 4-bedroom property.
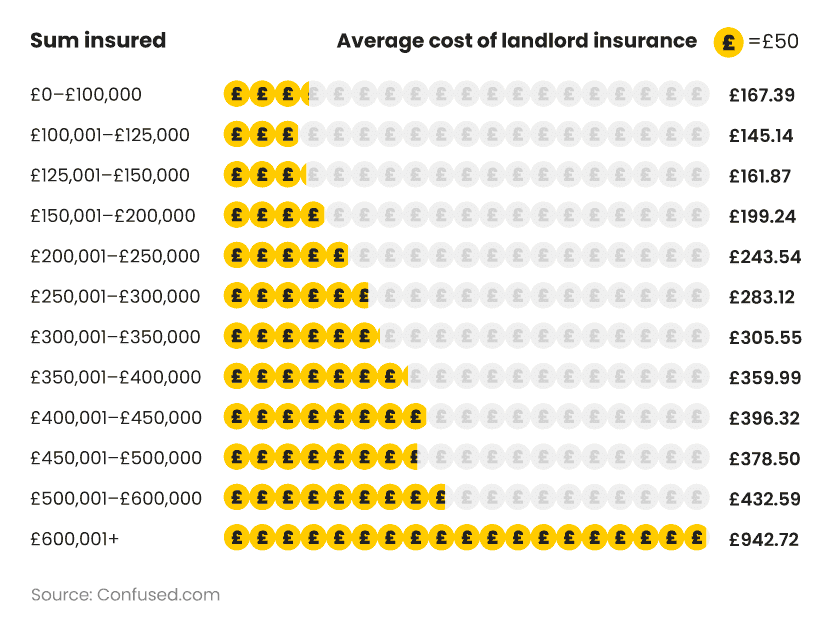
UK landlord insurance average cost by sum insured
The cost of landlord insurance tends to rise along with the value of sums insured on the property. The cheapest cost is generally for landlords looking to insure property with a value between £100,001 and £125,000, which averages £145.14 (excl IPT). This almost triples to £432.59 (excl IPT) for those valued between £500,001 and £600,000.
A breakdown of the average cost of landlord insurance (excl. IPT) by sum insured
Around a fifth (20%) of Confused.com customers between 2023-24 were looking to insure property with a value between £200,001 and £250,000. This yielded an average cost of £243.54 (excl IPT) for their landlord insurance – almost half compared to those insuring property between £500,001 and £600,000.
Strangely, landlords with the lowest sums insured values – i.e. less than £100,000 – didn’t pay the least on average for their cover. Instead, their policies were the third cheapest on average at £167.39 (excl IPT). This category accounted for just over 1 in 10 (12%) quotes over the year, making it the third most popular selection.
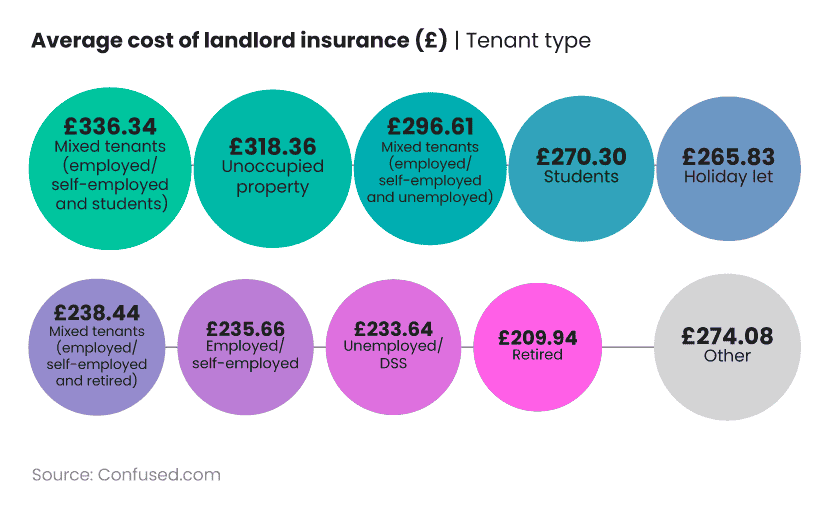
UK landlord insurance average cost by tenant type
Over three-quarters (78.9%) of Confused.com customers are landlords with tenants in some form of employment. Policies for these landlords cost £235.66 (excl IPT) on average.
A breakdown of the average cost of landlord insurance (excl IPT) by type of tenant
Landlords with retired tenants tend to have the lowest annual premiums for their landlord insurance at £209.94 (excl IPT). This is around a third less (-34%) than those looking to insure an unoccupied property.
UK landlord insurance average cost by payment method
More than 4 in 5 (84%) landlords pay for their insurance on an annual basis. On average, this costs just under £240 for the year.
A breakdown of the average cost of landlord insurance (excl IPT) - monthly vs annual payments
| Payment method | Average cost of landlord insurance (£) | Percentage of quotes |
|---|
| Annual | £239.51 | 84% |
| Monthly | £259.85 | 16% |
By contrast, customers paying monthly can expect to pay around 8% more for their landlord insurance premiums, resulting in an average cost of almost £260 per year (excl IPT).
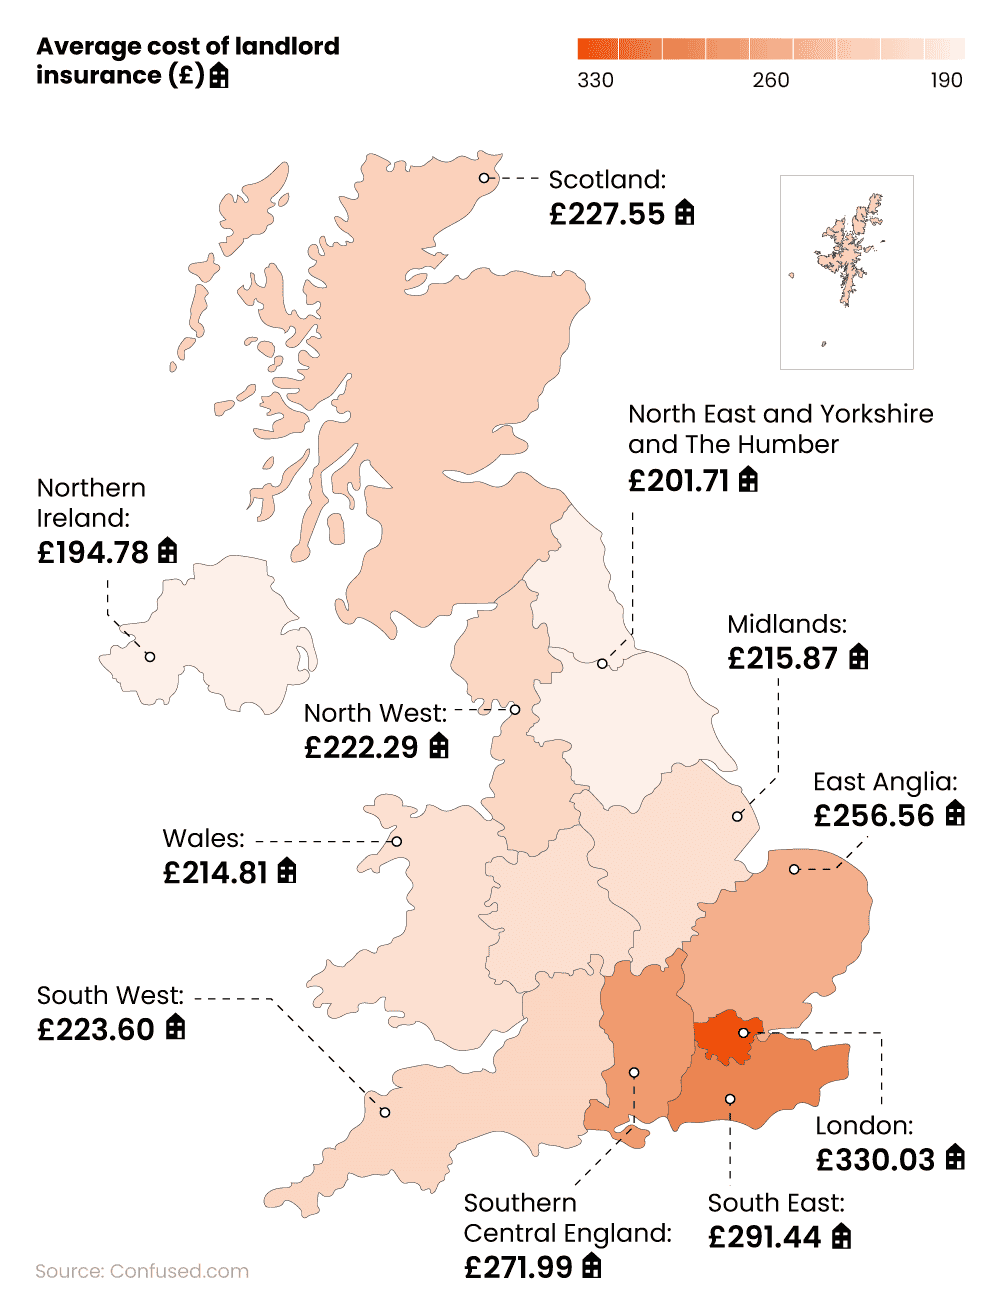
UK landlord insurance average cost by region
The average cost of landlord insurance varies slightly depending on which part of the country your property is located. For example, those in Northern Ireland tend to pay the least for their landlord insurance, with an average price of £194.78 (excl IPT).
By contrast, those in London can expect higher average premiums at just over £330 (excl IPT) a year – over two-thirds more (+69.4%) by comparison.
A breakdown of the average cost of landlord insurance (excl IPT) by region
The largest percentage of quotes requested on Confused.com between 2023-24 was from customers based in the Midlands. The average cost of a policy in this region was £215.87 (excl IPT). This was around a sixth (15.9%) cheaper than a typical policy for landlords insuring property in East Anglia – the second most popular region for landlord insurance quotes from Confused.com.
Why has landlord insurance gone up?
The main reason why the cost of landlord insurance has gone up in recent years is due to inflation and other economic factors facing property owners.
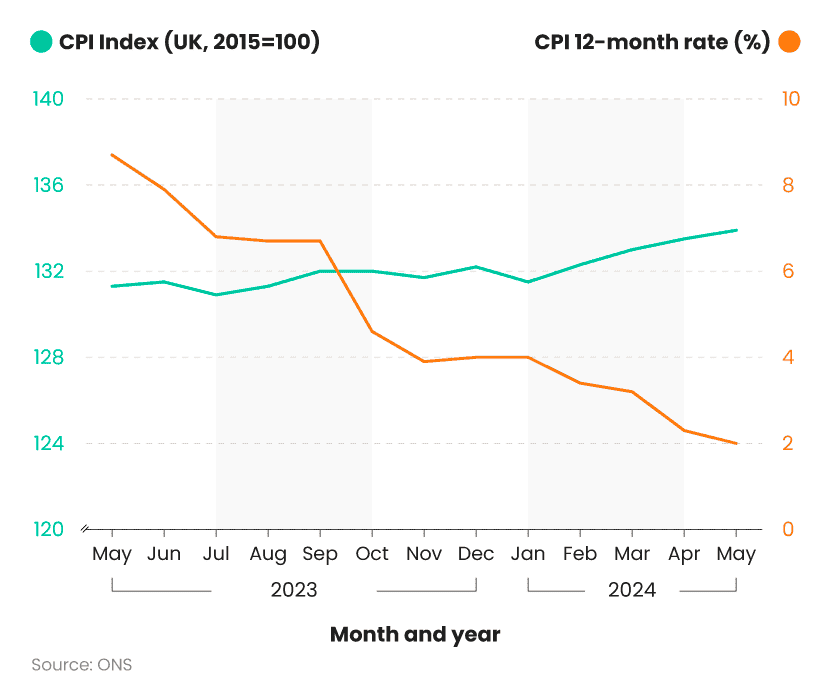
Inflation is measured by the Consumer Price Index (CPI). This rose by 2.8% in the 12 months to May 2024, down from 3.0% in the year to April. The knock-on effect for consumers is a rise in annual premiums.
A breakdown of the UK’s CPI between 2023-24
This is coupled with a rise in the BCIS Materials Cost Index (BCI), which dictates the overall cost of materials linked to building work. Industry experts predict a 15% rise in building costs between 2024 and 29.
That said, monthly construction output across Great Britain is estimated to have grown by 1.9% in May 2024 following a fall of 1.1% during the previous month. However, overall construction output is reckoned to have fallen by 0.7% in the three months to May 2024, which will likely lead to higher consumer costs.
According to the BCIS, building costs are set to increase by 15% between 2024-29. Tender prices are also expected to rise, increasing by almost a fifth (19%) over the same period. The BCIS anticipates overall construction output to fall by 5.5% in 2024 compared with the previous year. These combined factors could contribute to higher insurance costs for customers in the years to come.
Growth is expected to return in 2025, with new work output expected to increase by 20% by the second quarter of 2029.
Buildings insurance is usually covered within a standard landlord insurance policy. It protects you against the cost of repairing or rebuilding your property in the event of a disaster.
Statistics on UK landlord insurance claims
Most common landlord insurance claims in the UK
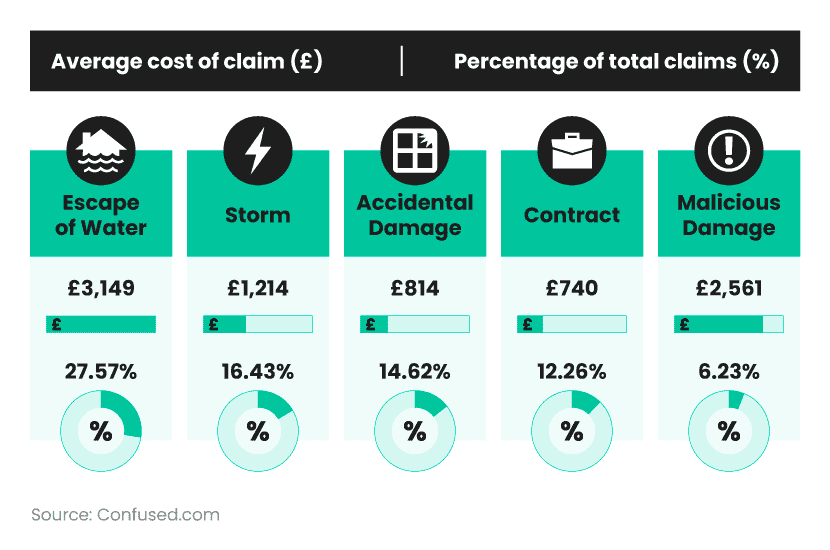
Based on Confused.com consumer data, the most common landlord insurance claim in 2023-24 involved the escape of water. This accounted for just over a quarter (27.57%) of all claims for the year. The average cost of this type of claim during this period was £3,149.33.
By comparison, around 1 in 6 (16.43%) claims across 2023-24 were caused by storms, the second most common claim type. With an average claim cost of £1,214.33, the average price of storm claims was 2.5 times lower than (-61.4%) those linked to escape of water.
Trace and access insurance is normally included as standard on a building insurance policy. It helps cover the cost of finding the source of a leak and making sure it’s accessible for repair work.
A breakdown of the most common UK landlord insurance claims and their associated average cost (excl IPT)
| Claim | Average cost of claim (£) | Percentage of total claims (%) |
|---|
| Escape of water | £3,149.33 | 27.57% |
| Storm | £1,214.33 | 16.43% |
| Accidental damage | £814 | 14.62% |
| Contract | £740.25 | 12.26% |
| Malicious damage | £2,561.17 | 6.23% |
| Internal pipes, damage to underground services | £134.66 | 4.32% |
| Damage to underground services | £1,320.92 | 4.19% |
| Heating system - main | £192.33 | 3.30% |
| Subsidence | £5,460.50 | 1.40% |
| Fire | £29,589.92 | 1.39% |
Accidental damage was the third most common claim in 2023-24, accounting for around 1 in 7 (14.62%) claims made by landlords. The average claim for accidental damage was £814 almost a third less (-32.9%) than those for storm damage. And almost three-quarters less (-74.15%) than for escape of water.
Across all claims made between 2023-24 by Confused.com customers, the average cost was £2,657.
Claims due to fire yielded the highest average cost across all categories at 29,589.92, yet only accounted for 1.39% of claims for the year. claims against subsidence were fractionally more common during this period, with the average claim being around £5,460.50.
Do you own and rent out a building that operates as a commercial premises? If so, commercial property insurance could help protect your property against fire, theft and damage.
Most common landlord insurance claims in the UK by region
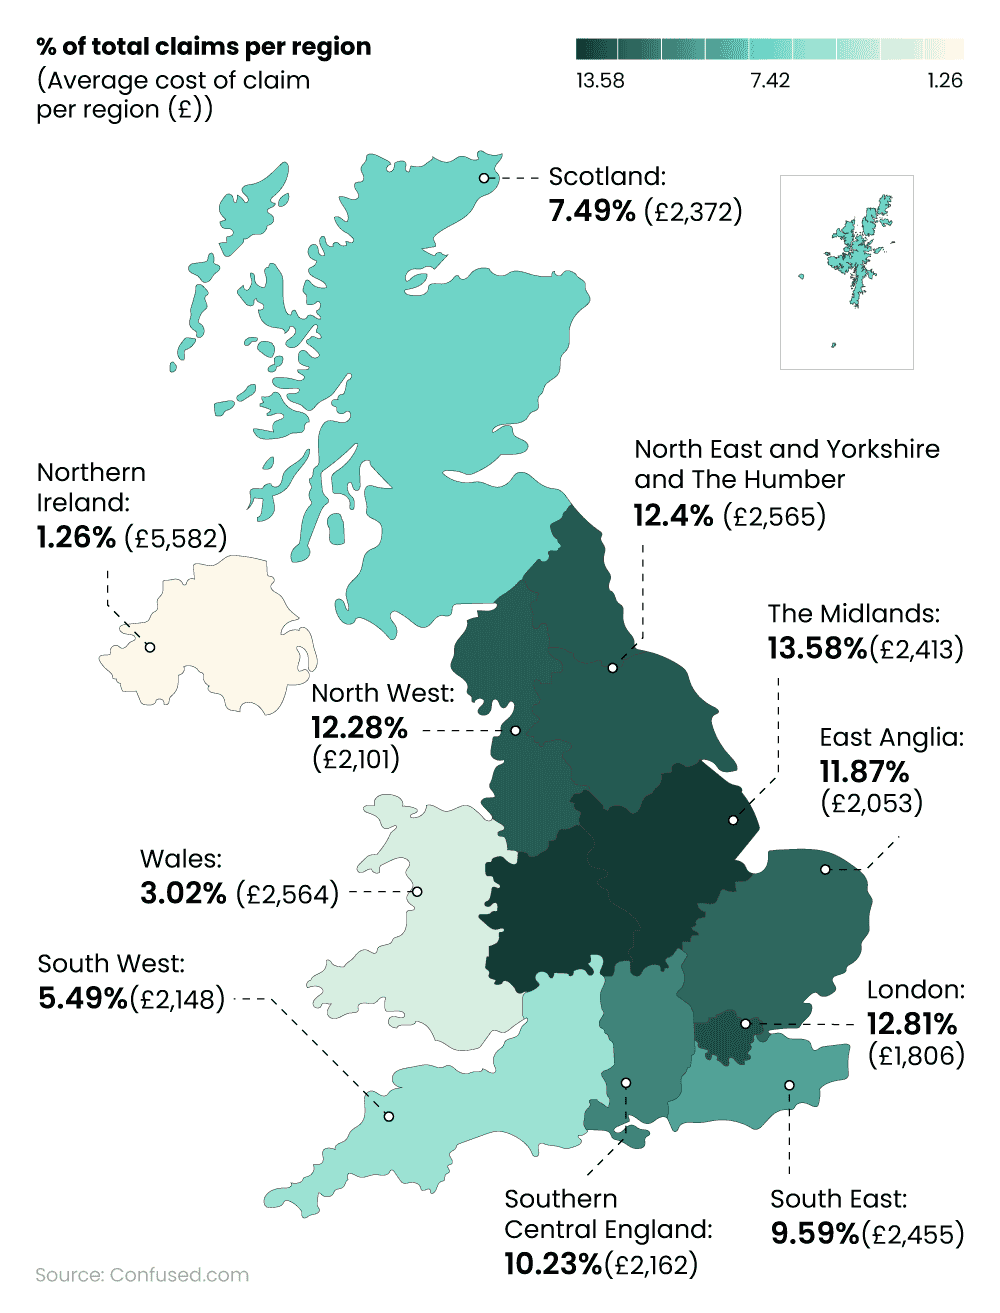
As of 2023-24, more claims were made against landlord insurance policies in the Midlands than in any other UK region. Almost 1 in 7 (13.58%) claims for the year came from this region, with an average cost of £2,413 per claim.
By contrast, just 1.26% of claims were from landlords of property in Northern Ireland. Yet, these had the highest average cost per claim across all UK regions (£5,582). This was around 3 times more expensive (+32%) than the average cost of claims for London rental properties (£1,806) – the lowest of all regions.
A breakdown of the most common UK landlord insurance claims by region and their associated average cost
| Region | % of total claims per region | Average cost of claim per region (£) |
|---|
| East Anglia | 11.87 | £2,053 |
| London | 12.81 | £1,806 |
| North East | 12.4 | £2,565 |
| North West | 12.28 | £2,101 |
| Northern Ireland | 1.26 | £5,582 |
| Scotland | 7.49 | £2,372 |
| Southern Central England | 10.23 | £2,162 |
| South East | 9.59 | £2,455 |
| South West | 5.49 | £2,148 |
| The Midlands | 13.58 | £2,413 |
| Wales | 3.02 | £2,564 |
The highest proportion of landlord insurance claims in 2023–24 across all UK regions was for escape of water. This was most prevalent in Scotland, accounting for two-fifths (40.7%) of all registered claims in the region over the 12-month period with the average claim costing £2,536.
A breakdown of the top 4 landlord insurance claims per region
| Region | Percentage & Cost | Escape of water | Storm | Accidental damage | Contract |
|---|
| East Anglia | % of total claims for the region | 28.93 | 12.58 | 13.99 | 13.99 |
| Average cost per claim | £2,683 | £785 | £640 | £801 |
| London | % of total claims for the region | 32.69 | 8.01 | 17.82 | 15.49 |
| Average cost per claim | £2,181 | £1,396 | £708 | £1,042 |
| North East | % of total claims for the region | 21.98 | 8.28 | 14 | 9.88 |
| Average Cost per claim | £3,105 | £1,089 | £672 | £735 |
| North West | % of total claims for the region | 21.63 | 21.48 | 12.87 | 12.01 |
| Average cost per claim | £2,635 | £1,307 | £694 | £791 |
| Northern Ireland | % of total claims for the region | 38.61 | 24.26 | 9.9 | 4.95 |
| Average cost per claim | £7,637 | £2,757 | £817 | £399 |
| Scotland | % of total claims for the region | 40.7 | 22.34 | 15.45 | 4.24 |
| Average cost per claim | £2,536 | £1,279 | £981 | £1,184 |
| Southern Central England | % of total claims for the region | 30.33 | 13.86 | 14.83 | 13.07 |
| Average cost per claim | £3,321 | £827 | £1,038 | £1,023 |
| South East | % of total claims for the region | 27.43 | 8.01 | 15.11 | 15.43 |
| Average cost per claim | £2,084 | £1,396 | £1,057 | £1,033 |
| South West | % of total claims for the region | 29.93 | 16.89 | 15.76 | 9.86 |
| Average cost per claim | £2,032 | £1,011 | £819 | £887 |
| The Midlands | % of total claims for the region | 21.34 | 16.67 | 13 | 13.51 |
| Average cost per claim | £3,128 | £1,358 | £883 | £722 |
| Wales | % of total claims for the region | 25.15 | 18.97 | 15.88 | 11.55 |
| Average cost per claim | £2,787 | £1,409 | £1,459 | £266 |
Northern Ireland had a slightly lower percentage of reported claims linked to escape of water – with 38.61% of total claims falling into this category. The average cost per claim for escape of water in this area was the highest reported across the UK at £7,637 – around three times more than a typical claim in Scotland.
The lowest average cost per claim for escape of water was found in the South West at £2,032, where they accounted for just under a third (29.93%) of all claims for the year.
Flood insurance is usually covered as standard on most landlord insurance policies. But it’s worth checking the terms and conditions with your provider. This is especially true if you live in a high flood risk zone where it’s important to make sure you have adequate financial cover against flooding.
 cookie usage