


The UK insurance sector is worth a reported £1.8 trillion, an important aspect of this is buildings insurance. This aims to provide financial protection if the structure and exterior of a home becomes damaged (such as walls, roof, and flooring).
Despite its importance, there is still some confusion surrounding buildings insurance. Many homeowners don’t understand how it differs from home insurance, and how much it costs as part of the overall protection for your home.
That’s why here at Confused.com, we’ve decided to crunch the numbers and collate a definitive buildings insurance statistics page for 2024. We cover how the property insurance industry has grown over time. We'll also show the various factors that can affect the average cost of buildings insurance, and the number of claims made.
Top 10 UK buildings insurance statistics 2024
- The average price of buildings insurance for Confused.com customers in 2023-24 was £187.29.
- Confused.com customers have seen an 87% increase in the average cost of buildings insurance between 2021 and 2024.
- Those aged between 46-50 typically pay the most for their buildings insurance, with an average cost of £178.42 per year.
- Around 9 in 10 (88.93%) quotes received by Confused.com between 2023-24 were for houses, with a typical buildings insurance cost of £164.64.
- Homeowners in the North of England could be paying around £50 a year less for their buildings insurance compared to those in the South.
- The most common buildings insurance claim in the UK in 2023-24 was for escape of water. This accounted for around two-fifths (42.07%) of all claims made by Confused.com customers between April 2023 and March 2024.
- In 2023-24, Confused.com customers living in Northern Ireland had the highest average cost of buildings insurance claims (£2,734). This is more than double the typical payout for those in Wales and Scotland.
- UK average wind speeds tend to be highest in Q1 at 9.8 knots.This is more than a quarter (27%) faster than Q2 and almost a third (29%) faster than Q3.
- Almost a third (32.43%) of the UK’s rain typically falls during the winter months (November - January) making it the wettest time of the year, on average.
- More than a quarter (26%) of tenants surveyed by Nationwide are mistakenly paying for building insurance.
UK building insurance cost statistics
What is the average cost of building insurance?
As of 2024, the average cost of buildings insurance for Confused.com customers was £187.29.
How has the average cost of building insurance changed over time?
Based on quotes from Confused.com customers, the average cost of buildings insurance has increased year-on-year since 2021, rising by 84.7% between 2021-24.
A breakdown of the average price of buildings insurance between 2021 and 2024
.jpg?la=en-gb&hash=D099230995E067A4F34F1341E13651BD)
In 2021, the average cost stood at £101.40, which then rose almost 11.5% by the end of 2022.
As of 2023, the average cost for Confused.com customers reached £147.86 – a rise of almost a third (30.8%) in 12 months. By 2024, this figure had increased again by more than a quarter (26.7%) to a typical cost of £187.29 for the year.
Factors that affect the cost of building insurance
- Age of homeowner
- Occupation and type of employment
- Value of property
- Type of property
- Number of bedrooms
- Location
- Desired payment method (i.e. monthly vs annual payments)
- Amount of voluntary excess
- No claims bonus history
UK building insurance average cost by type of property
As of 2024, those living in a flat can expect to pay marginally more for their insurance compared to most other property types.
According to Confused.com quote data, the average annual insurance cost for a flat is £167.48.
A breakdown of the average price of buildings insurance by property type
.jpg?la=en-gb&hash=97B1053E8EAE0D4C47D83280CF69B5E5)
| Property type | % of total quote requests | Average premium (£) |
|---|---|---|
|
Bungalow
|
5.69%
|
£153.17
|
|
Flat
|
4.08%
|
£167.48
|
|
House
|
88.93%
|
£164.64
|
|
Town house
|
0.79%
|
£150.08
|
|
Others
|
0.52%
|
£212.07
|
Almost 9 in 10 (88.93%) quotes received between 2023-24 were for houses. This makes them the most popular type of property in the UK for buildings insurance and generates a typical quote of £164.64.
Generally, bungalows produced the lowest average insurance cost (£153.17) – almost 10% less than a typical flat.
Non-standard home insurance is also available for properties that are listed buildings and/or have thatched roofs, prefabs, and timber frames. This is because these features are not normally seen on standard housing and can be harder to repair should they become damaged. This means from an insurer’s perspective, they might be considered higher risk and not necessarily covered on a standard buildings insurance policy.
A breakdown of the average price of buildings insurance by housing type
.jpg?la=en-gb&hash=8B9056C9DEAA5485289FB3D308DC8A61)
| Housing type | % of total quote requests | Average premium (£) |
|---|---|---|
|
Detached
|
26.86%
|
£194.78
|
|
Other
|
4.71%
|
£170.24
|
|
Semi-detached
|
32.47%
|
£156.48
|
|
Terraced
|
35.96%
|
£153.40
|
The average price of buildings insurance can also vary depending on the type of house you live in. More than a third (35.96%) of Confused.com quotes received between April 2023 and March 2024 were for terraced properties, at an average cost of £153.40.
By contrast, just over a quarter (26.86%) of quotes were for detached houses with an average price of £194.78. This works out to be almost a quarter (or £40 a year) more expensive by comparison.
UK building insurance average cost by property value
Generally speaking, as the value of a property increases, so does the average cost of buildings insurance. Based on Confused.com quote data, UK properties valued over £1 million can expect a typical policy cost of £361.29 – around double the national average.
Remember, how much home insurance you need will depend on the rebuild cost of your property.It doesn’t necessarily reflect its current market value or what you paid for it when you bought it. For more information, check out our guide on how to work out your home’s rebuild costs.
A breakdown of the average price of buildings insurance by value of property

| Property value | % of total quote requests | Average premium (£) |
|---|---|---|
|
£1 to £50k
|
0.97%
|
£143.37
|
|
£50k to £100k
|
4.72%
|
£136.89
|
|
£100k to £150k
|
10.07%
|
£135.98
|
|
£150k to £200k
|
12.07%
|
£134.40
|
|
£200k to £250k
|
11.14%
|
£137.13
|
|
£250k to £300k
|
10.27%
|
£144.48
|
|
£300k to £350k
|
8.33%
|
£152.64
|
|
£350k to £400k
|
7.25%
|
£163.14
|
|
£400k to £500k
|
11.83%
|
£181.44
|
|
£500k to £750k
|
14.09%
|
£216.21
|
|
£750k to £1m
|
5.10%
|
£275.20
|
|
Over £1m
|
4.16%
|
£361.29
|
By contrast, properties valued between £150k and £200k tend to produce the lowest average price at £134.40. This is almost three times cheaper, on average, compared to those valued at £1 million and above.
If you’re doing up your property at any point, then you might want to consider renovation insurance. Most home insurance policies only cover DIY and redecoration, so there may be some restrictions on what work you can do under your existing policy. It’s worth checking first before carrying out any work, to make sure you’re adequately covered.
UK building insurance average cost by the number of bedrooms
Typically, as the number of bedrooms within a property increases, so does the average cost of insurance.
According to Confused.com quote data, the average price of insurance for a property with 6 or more bedrooms in 2024 was £405.47. On the other hand, 2-bedroom properties tend to have the lowest average cost at £129.92. This is around 3 times less than a property with 6 or more bedrooms.
A breakdown of the average price of buildings insurance by the number of bedrooms
.jpg?la=en-gb&hash=7396FD610F9CF8F2D581AF339AFCEC47)
| Number of bedrooms | % of total quote requests | Average premium (£) |
|---|---|---|
|
1
|
2.02%
|
£132.19
|
|
2
|
16.62%
|
£129.92
|
|
3
|
49.41%
|
£151.20
|
|
4
|
22.13%
|
£198.82
|
|
5
|
7.83%
|
£275.62
|
|
6+
|
1.98%
|
£405.47
|
(Source: Confused.com)
Almost half (49.41%) of Confused.com quotes between April 2023 and March 2024 were for 3-bedroom properties, producing an average policy cost of £151.20.
UK building insurance average cost by region
Based on regional data, the average cost of buildings insurance can vary considerably depending on which part of the UK you’re located.
Those living in Northern Ireland were typically quoted the most for their insurance coverage. With an average cost of £286.85, it’s around £100 a year more than the national average.
Almost 1 in 5 (18.56%) quotes received between 2023-24 were from London-based properties. This generated an average price of just over £220 – around a quarter less (26.4%) compared to those in Northern Ireland.
A breakdown of the average price of buildings insurance by UK region
.jpg?la=en-gb&hash=F292A5A17700DD669F36B483E305EB26)
| Region | % of total quote requests | Average premium (£) |
|---|---|---|
|
East Midlands
|
7.03%
|
£142.24
|
|
Eastern
|
9.03%
|
£164.64
|
|
Isle of Man
|
0.00%
|
£121.97
|
|
London
|
18.56%
|
£220.04
|
|
North East
|
2.66%
|
£126.60
|
|
North West
|
11.52%
|
£142.81
|
|
Northern Ireland
|
2.32%
|
£286.85
|
|
Scotland
|
5.51%
|
£158.26
|
|
South East
|
13.54%
|
£170.78
|
|
South West
|
6.48%
|
£144.48
|
|
Wales
|
3.68%
|
£151.10
|
|
West Midlands
|
10.72%
|
£141.39
|
|
Yorkshire and The Humber
|
8.86%
|
£148.13
|
(Source: Confused.com)
Our data also suggests a north-south divide in terms of average buildings insurance costs. Residents in the North East and North West were typically quoted between £126 and £143 respectively for their insurance between April 2023 and March 2024. Those in the South West and South East received respective average quotes between £144 and £171 during the same period.
This means those living in the North of England could be paying around £50 a year less for their policy than their Southern counterparts.
By contrast, the average cost for those in Scotland was marginally higher compared to Wales (£158.26 vs £151.10, respectively). Yet, both were around £30 a year less than the UK average of £187.29.
UK building insurance average cost by age of homeowners
Based on Confused.com consumer quote data, the average cost of buildings insurance in the UK tends to increase with age. Those between 46-50 typically pay the most (£178.42) for their insurance, followed closely by customers aged 41-45 (£176.54).
A breakdown of the average price of buildings insurance by age of customer
.jpg?la=en-gb&hash=6152E3CA8E764179A8D87D2DD46968D8)
| Age bracket | % of total quote requests | Average premium (£) |
|---|---|---|
|
17-20
|
0.15%
|
£161.08
|
|
21-25
|
1.20%
|
£138.84
|
|
26-30
|
4.26%
|
£152.34
|
|
31-35
|
8.62%
|
£161.79
|
|
36-40
|
12.77%
|
£171.36
|
|
41-45
|
14.85%
|
£176.54
|
|
46-50
|
12.16%
|
£178.42
|
|
51-55
|
10.75%
|
£172.96
|
|
56-60
|
9.29%
|
£164.15
|
|
61-65
|
7.96%
|
£154.32
|
|
66-70
|
6.26%
|
£148.22
|
|
71-75
|
4.95%
|
£141.18
|
|
76-80
|
3.33%
|
£139.90
|
|
81+
|
3.44%
|
£145.06
|
(Source: Confused.com)
Those aged 21-25 and 76-80 tend to have the lowest premiums, with average insurance costs somewhere in the region of £138-£140 per year. This means those aged 41-50 tend to pay around a quarter (24.95%) more for their policies compared to those aged 21-25 and 76-80.
If you’re over the age of 50, you may want to consider an over-50s home insurance policy to help save you money on your insurance costs.
UK building insurance average cost by occupation
Typically, those who are retired pay less for their insurance compared to those in employment. The average cost of buildings insurance for those no longer working stood at £144.35, as of 2024.
A breakdown of the average price of buildings insurance by job type
.jpg?la=en-gb&hash=7581B027F68C0CE06FAAA3A4336BD7DF)
| Job type | % of total quote requests | Average premium (£) |
|---|---|---|
|
Retired
|
21.04%
|
£144.35
|
|
Working class occupations
|
12.71%
|
£150.18
|
|
Skilled working class
|
11.82%
|
£157.92
|
|
Unemployed
|
2.55%
|
£159.64
|
|
Students
|
0.29%
|
£165.41
|
|
White collar workers
|
29.62%
|
£171.56
|
|
Homemakers and carers
|
3.33%
|
£172.22
|
|
Middle-class occupations
|
10.78%
|
£186.96
|
|
Highly educated professionals and captains of industry
|
7.86%
|
£203.07
|
(Source: Confused.com)
At the other end of the scale, those considered highly educated professionals and captains of industry can expect to pay the most for their buildings insurance. Average costs of around £203.07 per year represent around a third (33.8%) more, or an extra £80 per year, compared to the retired population.
White collar workers formed the largest percentage of Confused.com quotes between 2023-24, at almost 1 in 3 (29.62%). The average policy price for this sector of society was £171.56 – around 10% less than the UK national average.
Incidentally, those from middle-class occupations can expect to pay around a fifth (21.8%) more for their home insurance compared to those from working-class occupations. This equates to around £35 extra per year.
A breakdown of the highest and lowest average price of buildings insurance by type of employment
.jpg?la=en-gb&hash=68AB2C922CEB1634535C3D3F3A30D0A0)
| Employment type | % of total quote requests | Average premium (£) |
|---|---|---|
|
Drivers - motorway
|
1.10%
|
£140.00
|
|
Unskilled workers
|
3.42%
|
£143.53
|
|
Homemakers/retired
|
24.24%
|
£148.48
|
|
Utilities
|
2.49%
|
£151.97
|
|
Military
|
0.23%
|
£152.08
|
|
Other
|
0.00%
|
£152.64
|
|
License/gaming trade
|
1.30%
|
£154.78
|
|
Skilled workers
|
8.47%
|
£157.66
|
|
Charity/social work
|
2.67%
|
£157.94
|
|
Service jobs
|
2.88%
|
£158.31
|
|
Motor trade
|
0.53%
|
£158.43
|
|
Unemployed
|
2.62%
|
£158.73
|
|
Emergency services
|
0.56%
|
£159.54
|
|
Agricultural work
|
0.57%
|
£160.36
|
|
Construction onsite
|
1.60%
|
£162.40
|
|
Office jobs
|
8.57%
|
£165.00
|
|
Drivers - city
|
3.44%
|
£165.45
|
|
Students
|
0.29%
|
£165.93
|
|
Office jobs
|
0.11%
|
£167.64
|
|
Sales office-based
|
1.63%
|
£168.13
|
|
Teaching
|
3.87%
|
£169.42
|
|
Medical professional
|
4.80%
|
£172.86
|
|
Competitive sports
|
0.09%
|
£177.08
|
|
Shop owners/proprietors
|
1.20%
|
£185.86
|
|
Null
|
0.54%
|
£185.92
|
|
Sales travelling
|
0.32%
|
£188.12
|
|
Professional
|
20.61%
|
£190.86
|
|
Arts
|
0.38%
|
£196.31
|
|
Entertainment
|
0.25%
|
£207.90
|
|
Journalism
|
0.10%
|
£216.45
|
|
Finance/Insurance
|
1.11%
|
£220.64
|
(Source: Confused.com)
The average cost of buildings insurance could vary considerably depending on the type of work you do. Confused.com quote data between April 2023 and March 2024 suggests those employed as motorway drivers typically have the lowest average policy costs at £140 a year. Yet, those working in the finance and insurance sector can expect an average quote of £220.64 – around 44.7% more by comparison.
Homemakers and the retired formed the largest percentage of quotes between 2023-24, at around 1 in 4 (24.4%). This was followed by around 1 in 5 (20.61%) from those in a professional job. Yet, the difference between their average quote was almost a quarter more (24.98%) for professionals, equating to around £40 extra per year.
UK buildings insurance average cost by the number of years of no-claims discount (NCD)
In general, policyholders with a greater number of years of no-claims discount (NCD) can expect to pay less for their buildings insurance.
Around two-fifths (42.17%) of Confused.com quotes between 2023-24 were for customers with 9 or more years of NCD. This generated an average policy cost of £157.
A breakdown of the average price of buildings insurance by the number of years of NCD
.jpg?la=en-gb&hash=FD9DF07D92B9D4300A2B10337EE6D437)
| Number of years of NCD | % of total quote requests | Average premium (£) |
|---|---|---|
|
0
|
19.06%
|
£178.54
|
|
1
|
7.65%
|
£168.28
|
|
2
|
6.65%
|
£170.24
|
|
3
|
5.12%
|
£172.48
|
|
4
|
4.35%
|
£162.88
|
|
5
|
5.28%
|
£160.48
|
|
6
|
3.70%
|
£154.80
|
|
7
|
3.29%
|
£159.46
|
|
8
|
2.73%
|
£164.64
|
|
9+
|
42.17%
|
£157.00
|
By contrast, around 1 in 5 quotes (19.06%) were for those with no years of NCD, equating to an average cost of £178.54. This works out around 12% less than those with 9 years or more of no claims (or roughly an extra £20 a year, on average).
UK building insurance average cost by payment method
As of 2024, the average cost of buildings insurance in the UK for an annual policy was £161.58.
A breakdown of the average price of buildings insurance between annual vs monthly payments
| Payment method | % of total quote requests | Average premium (£) |
|---|---|---|
|
Annual
|
81.88%
|
£161.58
|
|
Monthly
|
18.12%
|
£176.59
|
(Source: Confused.com)
Typically, around 4 in 5 (81.88%) of Confused.com customers look for an annual policy when purchasing buildings insurance. This could save them around £15 a year, on average, compared to those who choose to pay monthly.
UK building insurance average cost by the amount of voluntary excess
Broadly speaking, buildings insurance policies with a higher amount of voluntary excess tend to generate lower average costs. Based on Confused.com quote data, those who select £0 voluntary excess typically pay £182.53, compared to an average of £160.05 for those with £400 excess. This equates to around 13% less on average, by comparison.
A breakdown of the average price of buildings insurance by voluntary excess amount
.jpg?la=en-gb&hash=7F9B6B29928DEB23F93C6F553AAAAF31)
That said, once customers exceed £150 voluntary excess, the relative average cost of insurance decreases. Around 3 in 5 (57.77%) of quotes obtained by Confused.com between April 2023 and March 2024 were for those with £250 excess cover. This generated an average quote of £160.88. This is around £5 a year cheaper than the average quote with £150 excess and just 83p a year cheaper than those with £400 excess.
UK building insurance claims statistics
According to Financial Conduct Authority (FCA) data from 2022, around 3 in every 100 claims within the insurance industry are for buildings insurance. Of those made, around two-thirds (7.59%) are accepted, resulting in an average claims payout of just over £4,850.
A breakdown of UK buildings insurance claims statistics (2022)
| Buildings insurance | |
|---|---|
|
Claims frequency
|
3.19%
|
|
Claims acceptance rate
|
67.59%
|
|
Average claims payout
|
£4,856.18
|
|
Claim complaints as a % of claims
|
11.09%
|
|
Average number of policies in force
|
2,043,239
|
|
Total retail premiums (written)
|
£394,434,435
|
|
% of premiums paid out in claims
|
56.89%
|
As of 2022, there are approximately 2.04 million buildings insurance policies in the UK, with an estimated value of over £394 million.
In total, almost three-fifths (56.89%) of buildings insurance policies paid out for claims at some point during 2022.
Most common buildings insurance claims in the UK
According to Confused.com data, the most common buildings insurance claim in the UK in 2023-24 was escape of water. This equated to around two-fifths (42.07%) of all claims made by Confused.com customers between April 2023 and March 2024.
A breakdown of the UK’s most common buildings insurance claims
.jpg?la=en-gb&hash=2F00177F2E416F11908E8B2E5B5F6C4F)
| Type of claim | % of total claims |
|---|---|
|
Escape of water
|
42.07
|
|
Storm
|
22.81
|
|
Accidental loss/damage at home
|
12.97
|
|
Other causes at home
|
5.82
|
|
Malicious damage at home
|
5.01
|
|
Fire
|
2.61
|
|
Collision
|
2.58
|
|
Escape of water due to freezing
|
1.33
|
|
Flood
|
1.31
|
|
Subsidence
|
1.23
|
|
Falling trees
|
1.12
|
|
Leakage of oil
|
0.37
|
|
Occupiers liability
|
0.19
|
|
Lightning
|
0.16
|
|
Arson
|
0.15
|
|
Property owners liability
|
0.14
|
|
Falling aerials
|
0.06
|
|
Explosion
|
0.05
|
|
Riot civil commotion
|
0.02
|
|
Earthquake
|
0.01
|
(Source: Confused.com)
The next most common claim was as a result of storms. Around a fifth (22.81%) of consumers claimed against their policy for storm damage between 2023-24.
Around 1 in 10 (12.97%) claimed accidental damage or loss at home. Around half that amount claimed malicious damage (5.01%) or other causes at home (5.82%).
If your home has a history of subsidence, then you may struggle to find standard home insurance coverage. So, you may need to contact a broker to arrange for specialist subsidence insurance for your property.
UK buildings insurance claim statistics by customer age
When broken down by age, the average cost of buildings insurance claims can fluctuate. Claims range between £850 for those aged 17-20 and up to £1,250 for the 46-50 age bracket.
A breakdown of total buildings insurance claims and average cost by age of customer
| Age group | Average incident cost (£) | % of total claims |
|---|---|---|
|
17-20
|
£850
|
0.02%
|
|
21-25
|
£1,000
|
0.33%
|
|
26-30
|
£1,000
|
2.25%
|
|
31-35
|
£1,000
|
7.35%
|
|
36-40
|
£1,192
|
11.95%
|
|
41-45
|
£1,200
|
15.33%
|
|
46-50
|
£1,250
|
16.27%
|
|
51-55
|
£1,200
|
17.48%
|
|
56-60
|
£1,200
|
15.74%
|
|
61-65
|
£1,130
|
13.06%
|
|
66-70
|
£1,104
|
10.18%
|
|
71-75
|
£1,050
|
8.54%
|
|
76-80
|
£1,200
|
6.00%
|
|
81+
|
£1,250
|
4.47%
|
(Source: Confused.com)
Almost two-thirds (64.82%) of Confused.com customers are between the age of 41 and 60. Based on our data, they can expect an average insurance claim of £1,212, should they need to claim against their policy.
A breakdown of the most common buildings insurance claims by age of the customer and associated average cost

| Age group | Type of incident/claim | Average incident cost (£) | % of total claims |
|---|---|---|---|
|
17-20
|
Escape of water
|
£6,500
|
0.00%
|
|
21-25
|
Escape of water
|
£2,000
|
0.06%
|
|
26-30
|
Escape of water
|
£2,200
|
0.43%
|
|
31-35
|
Escape of water
|
£2,248
|
1.40%
|
|
36-40
|
Escape of water
|
£2,388
|
2.31%
|
|
41-45
|
Escape of water
|
£2,412
|
3.15%
|
|
46-50
|
Escape of water
|
£2,353
|
3.35%
|
|
51-55
|
Escape of water
|
£2,200
|
3.42%
|
|
56-60
|
Escape of water
|
£2,200
|
3.16%
|
|
61-65
|
Escape of water
|
£2,165
|
2.62%
|
|
66-70
|
Escape of water
|
£2,000
|
1.99%
|
|
71-75
|
Escape of water
|
£2,000
|
1.58%
|
|
76-80
|
Escape of water
|
£2,000
|
1.21%
|
|
81+
|
Escape of water
|
£2,000
|
0.86%
|
(Source: Confused.com)
According to our data, the most common type of buildings insurance claim across all age groups in the UK is escape of water. This typically yields an average cost of at least £2,000 per claim.
Those aged 41-45 tend to have one of the highest average claim costs for escape of water at £2,412 – almost a fifth (18.68%) more than those aged 17-30 and 66 and above.
For those living in high-risk flood areas, the Flood Re scheme helps homeowners access affordable flood insurance as part of their contents and buildings insurance coverage. The scheme is due to run until 2039, after which, home insurance companies may only offer insurance based on the risk to your property.
A breakdown of the most expensive average buildings insurance claims by age of customer
.jpg?la=en-gb&hash=D4664A6298738AD5F5E9DA1ABA425328)
| Age group | Type of incident/claim | Average incident cost (£) | % of total claims |
|---|---|---|---|
|
17-20
|
Fire
|
£150,000
|
0.00%
|
|
21-25
|
Fire
|
£15,000
|
0.01%
|
|
26-30
|
Arson
|
£11,320
|
0.00%
|
|
31-35
|
Explosion
|
£18,969
|
0.00%
|
|
36-40
|
Falling aerials
|
£189,900
|
0.00%
|
|
41-45
|
Leakage of oil
|
£11,750
|
0.01%
|
|
46-50
|
Leakage of oil
|
£10,000
|
0.03%
|
|
51-55
|
Fire
|
£7,000
|
0.19%
|
|
56-60
|
Flood
|
£15,752
|
0.11%
|
|
61-65
|
Flood
|
£10,000
|
0.07%
|
|
66-70
|
Earthquake
|
£25,001
|
0.00%
|
|
71-75
|
Flood
|
£16,689
|
0.05%
|
|
76-80
|
Leakage of oil
|
£25,000
|
0.02%
|
|
81+
|
Fire
|
£12,434
|
0.08%
|
(Source: Confused.com)
In terms of the most expensive average insurance claims between age groups, there is some considerable variation.
Falling aerials had an average claim cost of £189,900 between April 2023 and March 2024 for those aged 36-40. This is the most expensive claim on average across all age groups for the year. By contrast, fire was the costliest claim for 4 different age groups, ranging from £7,000 per claim for 51-55-year-olds up to £150,000 for those aged 17-20.
UK buildings insurance claim statistics by region
According to Confused.com consumer data, the majority of buildings insurance claims are made by those living in the South East. In this region, the average cost is £1,200 per claim.
A breakdown of total buildings insurance claims statistics by UK region
.jpg?la=en-gb&hash=EE42C7F30828BA1B7062F72816B7997D)
| Region | Average incident cost (£) | % of total claims |
|---|---|---|
|
East Midlands
|
£1,185
|
6.80%
|
|
Eastern
|
£1,200
|
10.86%
|
|
London
|
£1,333
|
11.61%
|
|
North East
|
£1,000
|
4.10%
|
|
North West
|
£1,100
|
10.30%
|
|
Northern Ireland
|
£2,734
|
2.40%
|
|
Scotland
|
£1,248
|
8.50%
|
|
South East
|
£1,200
|
16.80%
|
|
South West
|
£1,000
|
8.38%
|
|
Wales
|
£1,200
|
4.19%
|
|
West Midlands
|
£1,000
|
8.08%
|
|
Yorkshire and The Humber
|
£1,119
|
7.95%
|
|
(No lookup value)
|
£1,000
|
0.02%
|
Residents of Northern Ireland tend to have the highest average cost of building insurance claims (£2,734). This is more than double the typical payout for those in Wales and Scotland.
A breakdown of the most common buildings insurance claims by UK region
.jpg?la=en-gb&hash=609D185AE0136657514DB4184D6378F7)
| Region | Type of incident/claim | Average incident cost (£) | % of total claims |
|---|---|---|---|
|
East Midlands
|
Escape of water
|
£2,300
|
1.26%
|
|
Eastern
|
Escape of water
|
£2,316
|
2.50%
|
|
London
|
Escape of water
|
£2,500
|
2.48%
|
|
North East
|
Storm
|
£1,000
|
0.87%
|
|
North West
|
Escape of water
|
£1,980
|
1.72%
|
|
Northern Ireland
|
Escape of water
|
£5,429
|
0.88%
|
|
Scotland
|
Escape of water
|
£2,500
|
1.86%
|
|
South East
|
Escape of water
|
£2,000
|
3.71%
|
|
South West
|
Escape of water
|
£1,900
|
1.49%
|
|
Wales
|
Escape of water
|
£2,000
|
0.74%
|
|
West Midlands
|
Escape of water
|
£2,000
|
1.36%
|
|
Yorkshire and The Humber
|
Escape of water
|
£2,000
|
1.30%
|
(Source: Confused.com)
According to our data, the most common buildings insurance claim across UK regions is escape of water, affecting 11 out of 12 regions the most.
The average cost for escape of water varies considerably across the country. It can range from £1,900 in the South West up to £5,429 in Northern Ireland – almost 2.5 times the amount on average.
The only UK region where escape from water was not the most common claim was the North East. Here, it was storm damage, with an average cost of £1,000 per claim – the lowest across the country.
Trace and access cover is usually part of your buildings insurance policy as standard. This covers you against the cost of finding the leak and making the area accessible for repair work. It can also protect you if any repairs are needed to fix any damage caused by the search. But, it’s advisable to check the terms and conditions of your policy first, to make sure you’re covered in the event of escape of water.
A breakdown of the most expensive average buildings insurance claims by UK region
.jpg?la=en-gb&hash=7FFB164DDA9CA2DC42B42D49286BD67C)
| Region | Type of incident/claim | Average incident cost (£) | % of total claims |
|---|---|---|---|
|
East Midlands
|
Fire
|
£11,000
|
0.10%
|
|
Eastern
|
Explosion
|
£38,000
|
0.00%
|
|
London
|
Food
|
£11,225
|
0.07%
|
|
North East
|
Arson
|
£20,000
|
0.00%
|
|
North West
|
Leakage of oil
|
£18,000
|
0.00%
|
|
Northern Ireland
|
Property owners liability
|
£24,500
|
0.00%
|
|
Scotland
|
Fire
|
£8,200
|
0.10%
|
|
South East
|
Flood
|
£10,000
|
0.05%
|
|
South West
|
Explosion
|
£18,969
|
0.01%
|
|
Wales
|
Leakage Of oil
|
£15,000
|
0.01%
|
|
West Midlands
|
Falling aerials
|
£189,963
|
0.00%
|
|
Yorkshire and The Humber
|
Flood
|
£26,000
|
0.07%
|
(Source: Confused.com)
When broken down by region, the most expensive claims of 2023-24 came from the West Midlands in the form of falling aerials. This produced an average cost of £189,963 per claim.
The majority of other most expensive claims per region fell between £10,000 and £20,000 per claim, on average.
UK buildings insurance claim statistics by property type
According to our data, more than 4 in 5 (87.41%) claims made by Confused.com customers in 2023-24 came from those who live in a house. This produced an average incident cost of £1,200 per claim.
A breakdown of total buildings insurance claims statistics by type of property
| Property type | Average incident cost (£) | % of total claims |
|---|---|---|
|
Bungalow
|
£1,200
|
7.30%
|
|
Flat
|
£900
|
4.03%
|
|
House
|
£1,200
|
87.41%
|
|
Other
|
£1,441
|
0.54%
|
|
Town house
|
£1,155
|
0.72%
|
(Source: Confused.com)
By contrast, around 1 in 25 (4.03%) of Confused.com customers claiming between April 2023 and March 2024 live in a flat. Typically, their average incident cost was £900 per claim – around a quarter (28.57%) less than those living in a house.
A breakdown of the most common buildings insurance claims by type of property
| Property type | Type of incident/claim | Average incident cost (£) | % of total claims |
|---|---|---|---|
|
Bungalow
|
Escape of water
|
£2,450
|
1.37%
|
|
Flat
|
Escape of water
|
£2,065
|
0.58%
|
|
House
|
Escape of water
|
£2,150
|
17.62%
|
|
Others
|
Escape of water
|
£2,100
|
0.16%
|
|
Town house
|
Escape of water
|
£2,360
|
0.14%
|
(Source: Confused.com)
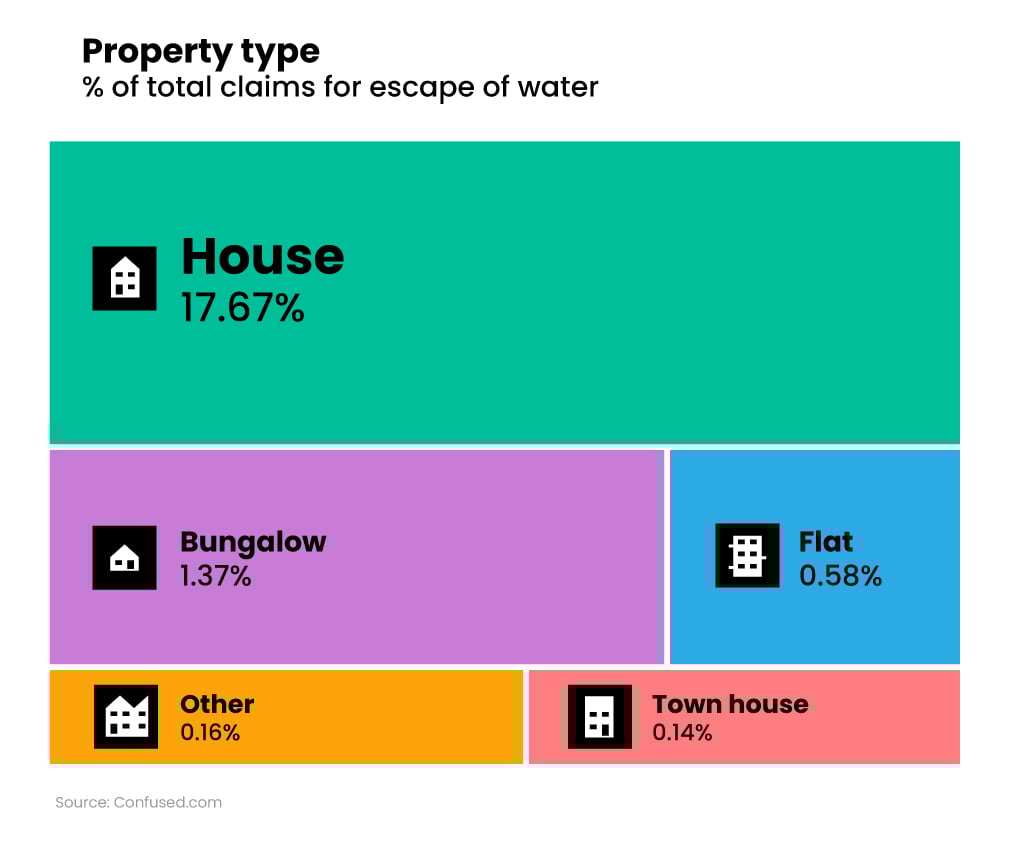
According to our data, the most common buildings insurance claim across all UK property types is the escape of water.
The average cost for escape of water for Confused.com customers between 2023-24 was typically lowest in flats at an average cost of £2,065 per claim. This rose on average by almost a fifth (17.05%) for those living in a bungalow.
A breakdown of the most expensive average buildings insurance claims by type of property
| Type of property | Type of incident/claim | Average incident cost (£) | % of total claims |
|---|---|---|---|
|
Bungalow
|
Explosion
|
£25,000
|
0.00%
|
|
Flat
|
Explosion
|
£100,000
|
0.00%
|
|
House
|
Leakage of oil
|
£10,000
|
0.15%
|
|
Others
|
Flood
|
£20,000
|
0.00%
|
|
Town house
|
Lightning
|
£23,000
|
0.00%
|
(Source: Confused.com)
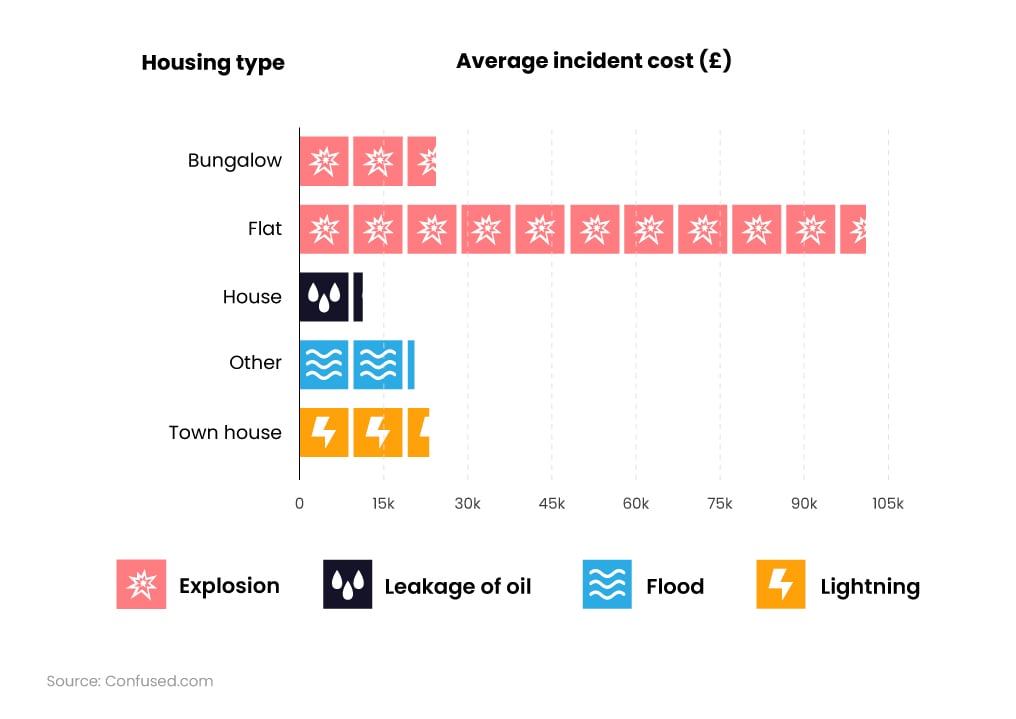
According to Confused.com quote data, the most expensive average buildings insurance claims by property type in 2023-24 were from explosions. This ranged from £25,000 per incident in bungalows up to £100,000 for flats.
By contrast, leakage of oil from houses produced the lowest average incident cost of 2023-24, at £10,000.
A breakdown of total buildings insurance claims statistics by type of housing
| Housing type | Average incident cost (£) | % of total claims |
|---|---|---|
|
Detached
|
£1,380
|
43.70%
|
|
Others
|
£988
|
4.80%
|
|
Semi-detached
|
£1,085
|
31.03%
|
|
Terraced
|
£1,000
|
20.47%
|
(Source: Confused.com)
More than two-fifths (43.7%) of claims made in 2023-24 by Confused.com customers were for detached housing. This generated an average incident cost of £1,380 – the most expensive out of all housing types.
Around 1 in 5 (20.47%) of claims were for terraced housing at an average cost of £1,000 per incident. This equates to almost a third (31.93%) less than the typical claim on a detached house by comparison.
A breakdown of the most common buildings insurance claims by type of housing

| Housing type | Type of incident/claim | Average incident cost (£) | % of total claims |
|---|---|---|---|
|
Detached
|
Escape of water
|
£2,461
|
9.05%
|
|
Others
|
Escape of water
|
£2,065
|
0.78%
|
|
Semi-detached
|
Escape of water
|
£2,000
|
5.83%
|
|
Terraced
|
Escape of water
|
£2,000
|
4.20%
|
(Source: Confused.com)
Escape of water was the most common type of claim made across all UK housing types in 2023-24 by Confused.com customers. Almost 1 in 10 claims (9.05%) were from detached houses, at an average cost of £2,461 per claim.
A similar percentage (10.03%) came from either semi-detached or terraced housing. This is an average cost of £2,000 per incident – around a fifth less (20.67%) than the typical escape of water claim for detached properties.
A breakdown of the most expensive average buildings insurance claims by type of housing

| Housing type | Type of incident/claim | Average incident cost (£) | % of total claims |
|---|---|---|---|
|
Detached
|
Flood
|
£17,500
|
0.22%
|
|
Others
|
Explosion
|
£100,000
|
0.00%
|
|
Semi-detached
|
Explosion
|
£40,000
|
0.00%
|
|
Terraced
|
Leakage of oil
|
£20,798
|
0.01%
|
The most expensive insurance claims for 2023-24 varied considerably between different property types, ranging from £17,500 per incident of flooding in detached housing up to £100,000 per claim for explosions in other types of housing.
Standard home insurance policies generally don’t cover properties that are unoccupied for more than 30 consecutive days. Therefore, you may need a specialist second home insurance policy to make sure you’re fully covered and protected against risks.
UK buildings insurance claim statistics by age of housing
According to our data, around a third (34.11%) of claims made in 2023-24 by Confused.com customers were either from houses built in the 1930s or 1970s. This resulted in an average claim of £1,200 per incident.
A breakdown of total buildings insurance claims statistics by age of housing
| Decade built | Average incident cost (£) | % of total claims |
|---|---|---|
|
1900s
|
£1,167
|
10.33%
|
|
1910s
|
£1,200
|
1.05%
|
|
1920s
|
£1,200
|
2.04%
|
|
1930s
|
£1,200
|
17.15%
|
|
1940s
|
£1,200
|
1.35%
|
|
1950s
|
£1,104
|
7.42%
|
|
1960s
|
£1,100
|
5.95%
|
|
1970s
|
£1,200
|
16.96%
|
|
1980s
|
£1,200
|
5.23%
|
|
1990s
|
£1,200
|
10.17%
|
|
2000s
|
£1,200
|
7.87%
|
|
2010s
|
£1,000
|
6.19%
|
|
2020s
|
£918
|
1.03%
|
(Source: Confused.com)
Houses built in the 2020s typically had the lowest average cost at £918 per claim. This is around a quarter (26.63%) less than those built a century earlier.
Knowing when your house was built can also have an impact on the cost of your buildings insurance. It’s important to know how old your property is for insurance purposes.
A breakdown of the most common buildings insurance claims by age of housing
.jpg?la=en-gb&hash=012F2EDEE4026BF32C70F09620993D56)
| Decade built | Type of incident/claim | Average incident cost (£) | % of total claims |
|---|---|---|---|
|
1900s
|
Escape of water
|
£2,000
|
2.17%
|
|
1910s
|
Escape of water
|
£2,400
|
0.22%
|
|
1920s
|
Escape of water
|
£2,150
|
0.38%
|
|
1930s
|
Escape of water
|
£2,100
|
3.33%
|
|
1940s
|
Escape of water
|
£2,700
|
0.25%
|
|
1950s
|
Escape of water
|
£2,000
|
1.38%
|
|
1960s
|
Escape of water
|
£2,000
|
1.10%
|
|
1970s
|
Escape of water
|
£2,000
|
3.52%
|
|
1980s
|
Escape of water
|
£2,118
|
1.27%
|
|
1990s
|
Escape of water
|
£2,400
|
2.23%
|
|
2000s
|
Escape of water
|
£2,505
|
1.70%
|
|
2010s
|
Escape of water
|
£2,200
|
0.86%
|
|
2020s
|
Escape of water
|
£1,800
|
0.12%
|
(Source: Confused.com)
The most common buildings insurance claim by Confused.com customers between April 2023 and March 2024 was for the escape of water. The average cost of this ranged from £1,800 per incident for houses built in the 2020s. This rises to £2,700 per claim for those built in the 1940s – a difference of 40%.
A breakdown of the most expensive average buildings insurance claims by age of housing

| Decade built | Type of incident/claim | Average incident cost (£) | % of total claims |
|---|---|---|---|
|
1900s
|
Explosion
|
£18,969
|
0.01%
|
|
1910s
|
Leakage of oil
|
£100,000
|
0.00%
|
|
1920s
|
Leakage of oil
|
£12,000
|
0.00%
|
|
1930s
|
Flood
|
£10,000
|
0.10%
|
|
1940s
|
Arson
|
£38,000
|
0.00%
|
|
1950s
|
Leakage of oil
|
£10,000
|
0.01%
|
|
1960s
|
Flood
|
£17,000
|
0.03%
|
|
1970s
|
Earthquake
|
£15,000
|
0.00%
|
|
1980s
|
Leakage of oil
|
£29,000
|
0.01%
|
|
1990s
|
Flood
|
£30,000
|
0.05%
|
|
2000s
|
Flood
|
£11,114
|
0.02%
|
|
2010s
|
Leakage of oil
|
£14,000
|
0.01%
|
|
2020s
|
Explosion
|
£500,000
|
0.00%
|
(Source: Confused.com)
Based on Confused.com customer data from 2023-24, the most expensive average claim made was for an explosion in a house built in the 2020s. However, this could be considered an anomaly.
At the other end of the scale is flooding in houses built in the 1930s and leakage of oil from those built in the 1950s. This generated an average cost of £10,000 per incident in 2023-24. Or 192% less than the cost of the recorded explosion in the property built in the 2020s.
According to the National Heritage List for England (NHLE), there are an estimated 500,000 listed buildings in England. With more than 1,000 reported fires to listed buildings in 2019 alone, you could consider specialised listed building insurance if you have an older property. This may help cover the cost of sourcing original materials or expert labourers in the unfortunate event that your older property needs repairing.
How extreme weather can affect building insurance claims in the UK
Windiest months in the UK
High wind speed is a common cause of building insurance claims, as strong gales can cause roof tiles to be removed, and trees to fall. Between 2018 and 2023, the most vicious winds were recorded in Q1 2020, when the UK’s average wind speed hit 11.5 knots. This was 1.6 knots faster than the UK’s second windiest quarter during this period (Q1 2022).
A breakdown of quarterly UK average wind speed statistics (2018-23)
.jpg?la=en-gb&hash=3C229C765BE029A2EEAB956E993E8E77)
The slowest average wind speed in the UK was recorded in Q3 2021 – almost 15% slower compared to the same time in 2020.
Between 2018 and 2023, high winds in the UK were generally at their most severe in the first quarter of the year. UK average wind speed between January and March typically reaches 9.8 knots. This is more than a quarter (27%) faster than the average for Q2 and almost a third (29%) faster than Q3. UK average wind speeds tend to pick up again in Q4, with an average of 8.8 knots between October and December.
Based on historical data, the UK’s lowest average wind speed is generally recorded between July and September. From 2018 to 2023, the average wind speed was 7.3 knots – only fractionally slower than April-June, when typical wind speeds were 7.5 knots.
Buildings insurance flood risk
Heavy rainfall can often increase the risk of extreme flooding. This may result in homeowners having to claim on their buildings insurance policy, should their property get damaged from rising water levels.
The UK month with the heaviest rainfall between 2014 and 2023 was December 2015, when 216.9mm of rain fell across the month. This averaged out at almost 7mm per day.
A breakdown of total rainfall in the UK by month (2014-2023)
.jpg?la=en-gb&hash=6C28879F33EF5B0BEAFF877331D3D7CE)
At the other end of the scale, April 2021 was the driest month on average between 2021 and 2023, with just 20.5mm of rainfall. This is around 8 times less rain than the wettest month for 2021 (October) at 167.8mm.
There is no such thing as a standalone flood insurance policy as flooding is covered on all home insurance policies as standard. But, bear in mind that a singular buildings insurance policy will only cover you against damage to the property (i.e. structure, fittings, and fixings). If you live in a high-risk, flood area, it would be worth investigating the Flood Re scheme to see if you’re eligible for financial support.
A breakdown of total rainfall in the UK by month (2014-2023)
.jpg?la=en-gb&hash=23D639A304D3DF7D737BD918B4FB855F)
According to rainfall statistics from the Met Office, the wettest month in the UK between 2014 and 2023 was December, with 1389.3mm of total rainfall. This equates to around 11.7% of the UK’s total rainfall for the year.
By contrast, the UK’s driest month on average is April. At 526.1mm of rain across the last decade, this is around 2.5 times less than what can be expected in December.
A breakdown of average rainfall in the UK by year (2014-2023)
.jpg?la=en-gb&hash=A48EB0D5C5AB362150783D63B66C5F23)
A breakdown of average rainfall in the UK by month (2014-2023)
.jpg?la=en-gb&hash=AC7469E1DB3CE54B614BCA6733A93B0B)
In terms of average rainfall statistics, December tends to be the wettest month in the UK. With average rainfall recordings of 138.93mm across the month, this is around 90% more than a typical April (normally the driest month of the year).
Around a third (32.43%) of the UK’s rain will typically fall during the winter months (November - January). This is the time of year that UK homeowners should be most prepared for rising water levels, especially those living in flood-prone regions.
A breakdown of average rainfall in the UK by year (2014-2023)
.jpg?la=en-gb&hash=2FFE18779B98236F45A760F245D6B5B3)
Between 2014 and 2023, average rainfall figures have fluctuated somewhere between 87mm and 112mm per year. Based on mean average rainfall, 2018 was the driest year on record within the last decade (87.78mm). This is around a quarter (23.98%) less rain for the year than the wettest (2020).
UK building insurance and renters
One of the benefits of renting is that tenants don’t require building insurance. Legally, landlords are obligated to cover the cost of building insurance, as they are the property owners. Renters need only to be concerned with contents insurance.
However, according to a survey by Nationwide, many renters are paying for building insurance they don’t need. They found that more than a quarter (26%) of tenants are mistakenly paying for building insurance despite it being the landlord’s responsibility.
Almost a third (32%) of renters admitted failing to cancel their home insurance when they moved out of their rented accommodation. This means thousands of renters have paid for cover they don’t need, for a property they no longer live in.
Close to half (48%) of renters also revealed they don’t have any contents insurance, wrongly believing that it’s covered by their landlord’s insurance.
Do tenants need buildings insurance?
No, it’s the responsibility of the landlord to ensure a valid buildings insurance policy is in place for the property they are renting.
Commercial property insurance statistics
As of 2023, the commercial property insurance market had an estimated value of £13.3 billion – an increase of 128% within the last 7 years.
A breakdown of the total value of the commercial building insurance market
.jpg?la=en-gb&hash=7B6DFB78771B1AE460A9319710940C1E)
Back in 2017, the commercial buildings insurance industry was valued at £5.82 billion. By the end of 2021, it had almost increased by two-thirds in value (+54.98%), before surpassing the £10 billion mark in early 2022.
Buildings insurance glossary
Aggregate limit
The maximum amount an insurance policy will pay for all covered losses during a specific policy period.
Claim
A formal request made by the policyholder to the insurance company for compensation, due to a covered loss or damage.
Policyholder
The individual or company that owns the building and holds the building insurance policy.
Premium
The amount paid by the policyholder to the insurance company to secure coverage for the building.
Confused.com internal data (buildings insurance quotes between April 2023 and March 2024)
https://www.fca.org.uk/publications/data/general-insurance-value-measures-data-2022
https://historicengland.org.uk/listing/what-is-designation/listed-buildings/
https://www.statista.com/statistics/322789/quarterly-wind-speed-average-in-the-united-kingdom-uk/
https://www.statista.com/statistics/584914/monthly-rainfall-in-uk/
https://www.globaldata.com/store/report/uk-commercial-property-insurance-market-analysis/